Priced properly, the last fifty years are a story of relentless deflation in the cost of doing anything useful, and the rate is still increasing. Compute, inference, and the length of time an autonomous system can work unattended are all improving on curves that bend upward rather than flatten. The one sector running the other way is the one where price is set by policy rather than by production.
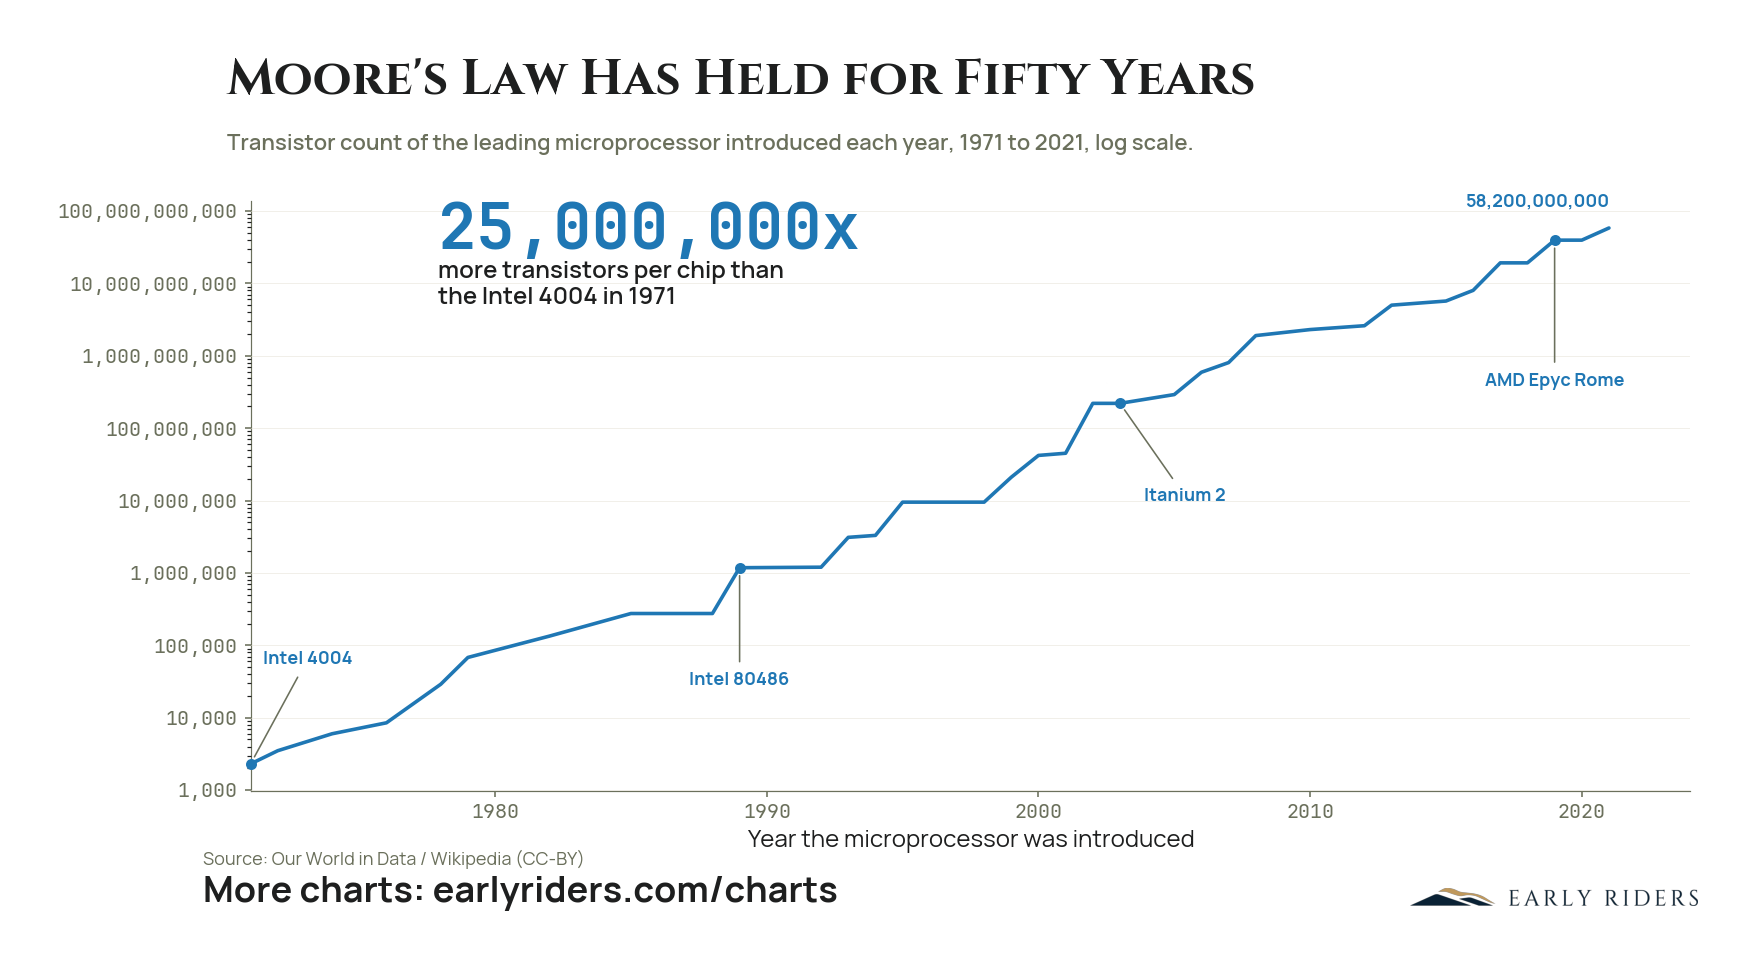
The leading microprocessor went from about 2,300 transistors on the Intel 4004 in 1971 to 58.2 billion on AMD Epyc Rome, a 25,000,000x increase sustained for fifty years.
Transistor counts on the best available microprocessor rose from about 2,300 on the Intel 4004 in 1971 to 58.2 billion on AMD Epyc Rome, an increase of roughly 25,000,000 times. Plotted on a log scale the progression is close to a straight line across fifty years, which is what makes it remarkable. The Intel 80486 crossed one million transistors in 1989, Itanium 2 passed 200 million in 2003, and the ceiling has risen by orders of magnitude every decade since without a decade of stall. Compounding at that rate for half a century is the closest thing modern industry has to a constant. The data here comes from Our World in Data and Wikipedia under CC-BY, not from Early Riders. For anyone deciding where capital sits, the practical reading is that the cost of computation keeps falling on a schedule reliable enough to underwrite long-horizon commitments. That same falling cost curve is what secures a proof-of-work network at ever greater scale, and what makes any thesis built on cheap, abundant compute a bet on continuation rather than on a new invention. The risk is not that the trend reverses tomorrow. It is that people underestimate how far a straight line on a log chart travels in another ten years.
How much have transistor counts increased since the first microprocessor?
About 25,000,000 times. The leading microprocessor carried roughly 2,300 transistors on the Intel 4004 in 1971 and 58.2 billion on AMD Epyc Rome by 2021, a fifty-year run that plots as a near straight line on a log scale, per Our World in Data and Wikipedia.
Chart data: Transistor count of the leading microprocessor introduced each year, 1971 to 2021, log scale.
Period
1971 to 2021
Plotted
Transistor count of the leading microprocessor, with Intel 4004, Intel 80486, Itanium 2, and AMD Epyc Rome annotated
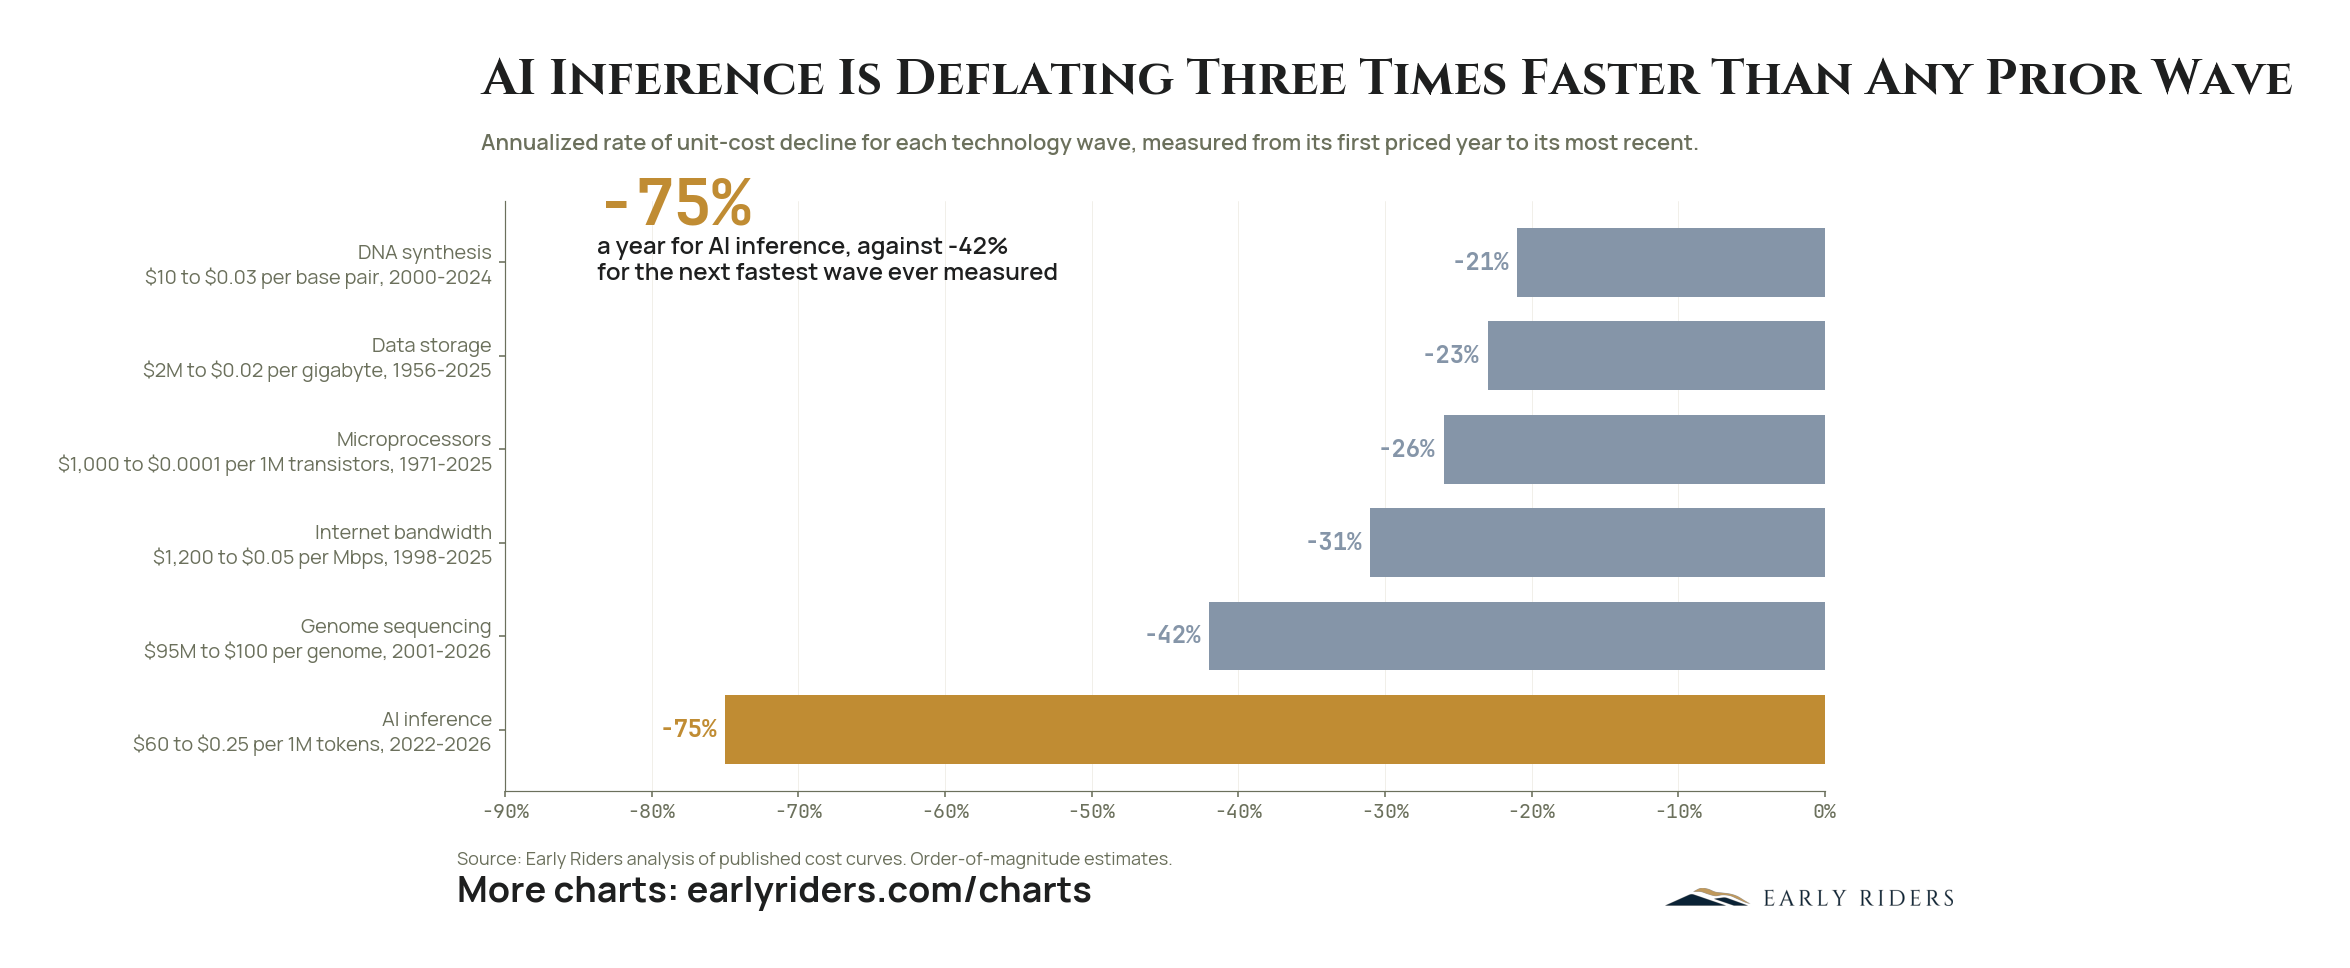
AI inference costs are falling about 75% a year, roughly three times the rate of genome sequencing, the fastest wave previously measured.
One million tokens of AI inference cost $60 in 2022 and $0.25 in 2026, an annualized decline of about 75%. Nothing else on record comes close. Genome sequencing, the previous champion, fell 42% a year as the cost of a genome went from $95 million in 2001 to roughly $100. Internet bandwidth fell 31% a year, microprocessors 26%, data storage 23% from $2 million per gigabyte in 1956 to about two cents, and DNA synthesis 21%.
Two caveats belong on the table. These are order-of-magnitude estimates drawn from published cost curves rather than precise measurements, and the windows are not equal: storage has been falling for seventy years while inference has four years of history. Long-distance calling is left out entirely, because a call that cost $500 in 1915 now rounds to zero, which makes an annualized rate undefined rather than infinite.
The structural point is that each wave ran on infrastructure the previous one built and then built the platform the next one used. Semiconductors made cheap storage possible, storage and compute made sequencing possible, and GPUs and data centers now carry inference. Capital deployed against this pattern should assume the cost floor keeps moving. Margin built on the current price of inference is not durable margin, because the same output will be roughly a quarter as expensive within a year. Value accrues to whoever owns the scarce input rather than the deflating one.
How fast are AI inference costs falling compared with past technologies?
About 75% a year. One million tokens fell from $60 in 2022 to $0.25 in 2026. That is roughly three times the annualized decline of genome sequencing at 42%, and more than double internet bandwidth at 31%, microprocessors at 26%, data storage at 23% and DNA synthesis at 21%.
Chart data: Annualized rate of unit-cost decline for six technology waves, each measured from its first priced year to its most recent.
Period
1956 through 2026
Plotted
DNA synthesis, Data storage, Microprocessors, Internet bandwidth, Genome sequencing, AI inference
Source
Early Riders analysis of published cost curves. Order-of-magnitude estimates.
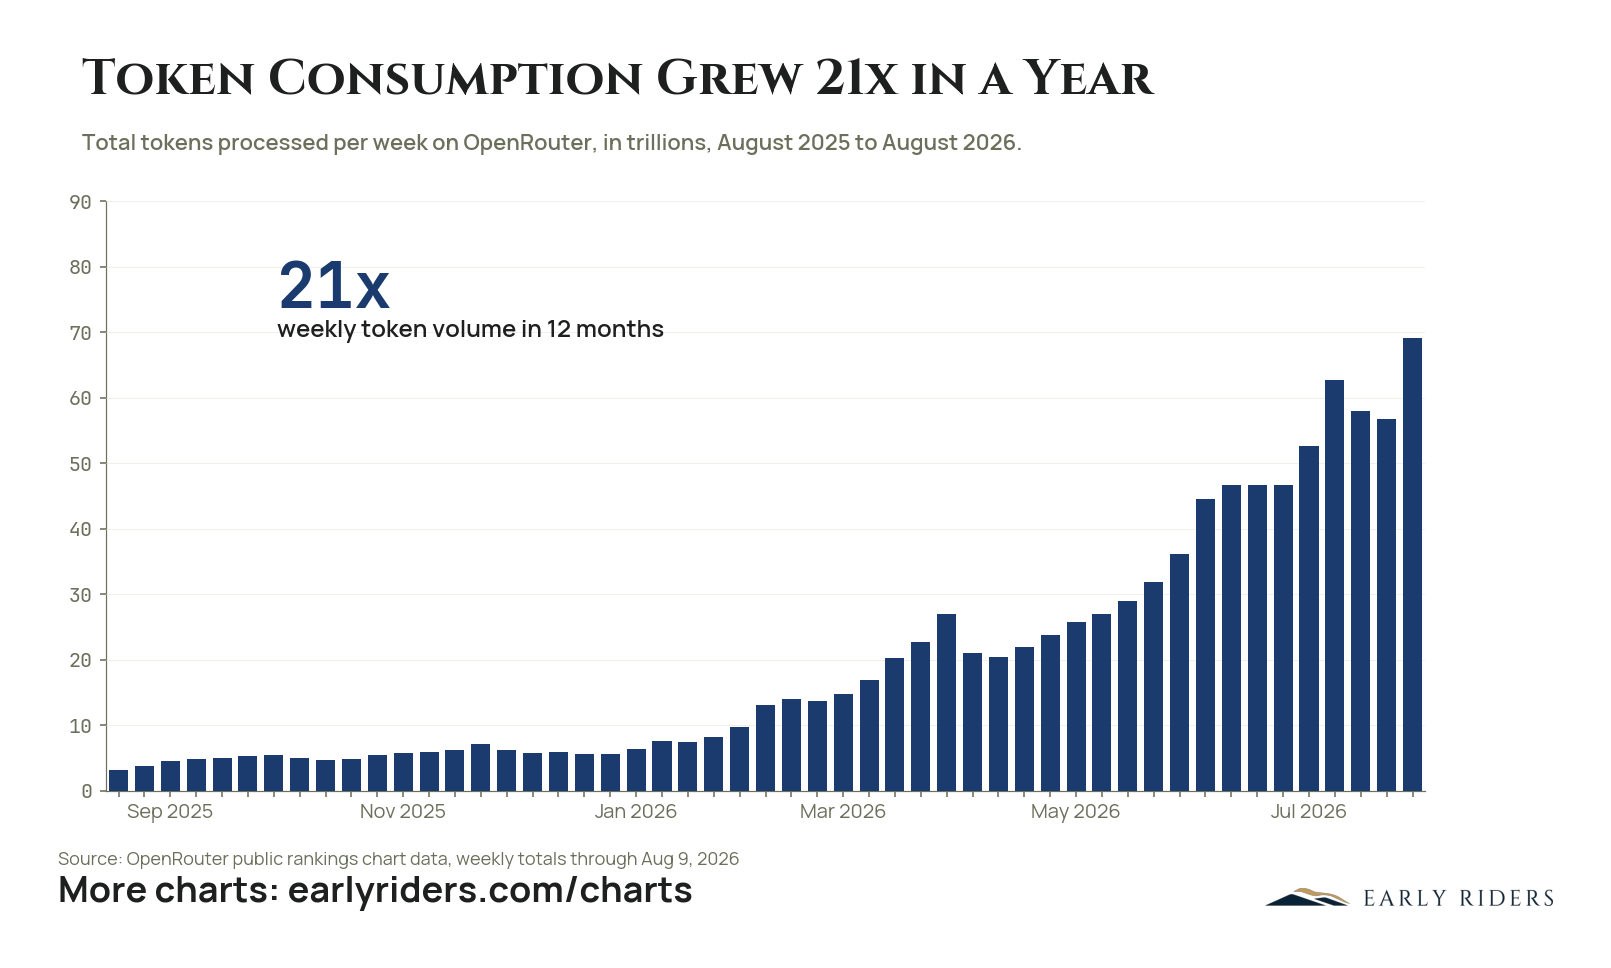
Weekly token volume on OpenRouter grew from 3.2 trillion to 69 trillion in twelve months, and the curve is still steepening.
OpenRouter is an open marketplace that routes AI requests across hundreds of models from every major lab, which makes its traffic one of the cleanest public reads on aggregate token demand. That traffic grew from 3.2 trillion tokens a week in August 2025 to 69 trillion by early August 2026, a 21x increase in twelve months. The curve is steepening rather than flattening: weekly volume crossed 10 trillion in February, 25 trillion in May, and touched 69 trillion in the first week of August. The growth came while the market price per token kept falling, which is the pairing that matters. A 90% price decline against flat usage would describe a shrinking market. A 90% price decline against 21x usage growth describes a good being integrated into everything. Cheaper intelligence expands the set of work worth automating, and token volume follows that expansion.
How fast is AI token consumption growing?
On OpenRouter, an open marketplace that routes requests across hundreds of AI models, total tokens processed per week grew from 3.2 trillion in August 2025 to 69 trillion in August 2026, a 21x increase in twelve months, and the weekly curve is still steepening.
Chart data: Total tokens processed per week on OpenRouter, in trillions, August 2025 to August 2026.
Period
August 2025 to August 2026
Plotted
Total tokens processed per week, prompt and completion, across all models on OpenRouter
Source
OpenRouter public rankings data, weekly totals through August 9, 2026
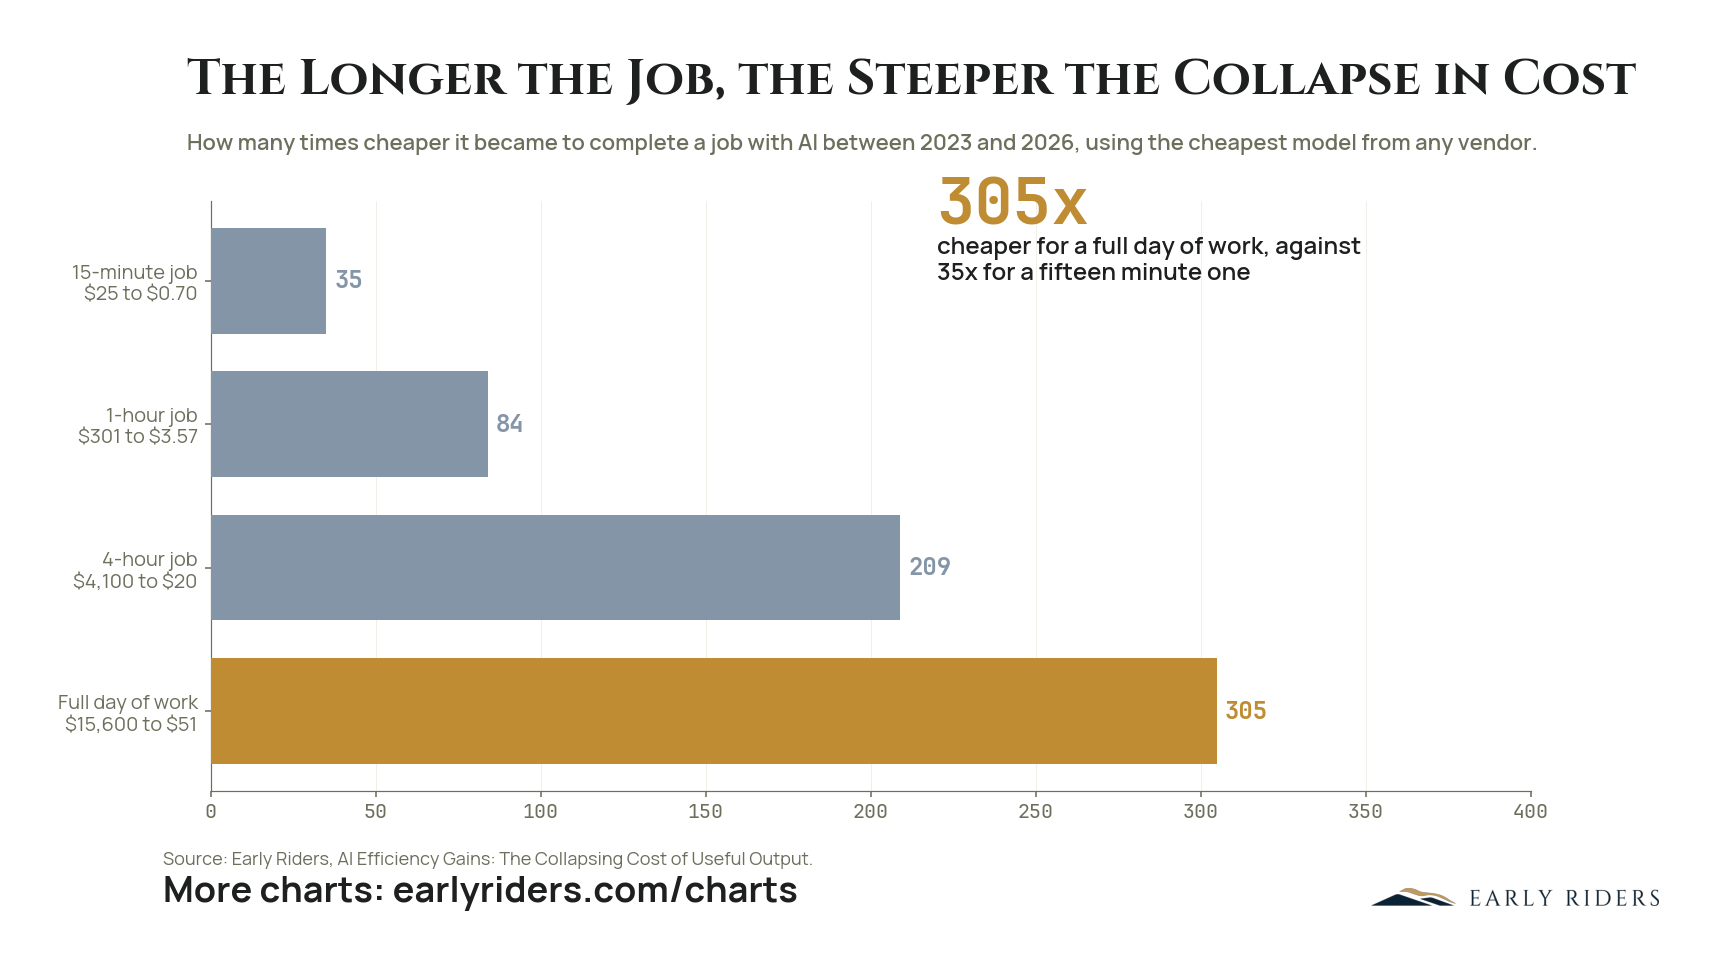
The cost of completing a full day's work with AI fell about 305 times between 2023 and 2026, against 35 times for a fifteen minute task.
Between 2023 and 2026 the cost of completing a job with AI fell at every duration, but not evenly. A fifteen minute task went from about $25 to $0.70, roughly 35 times cheaper. An hour went from $301 to $3.57. A four hour job went from $4,100 to $20. A full day of work went from $15,600 to $51, about 305 times cheaper. Every figure uses the cheapest model available from any vendor at the time.
The gradient is the finding. In 2023 long jobs were not merely expensive, they were close to impossible: models failed them most of the time, so the expected cost was dominated by retries rather than by the work itself. What collapsed was not only the price per token but the failure rate, and the two compound. Reliability is why a full day fell nine times further than fifteen minutes did.
That changes what the cost curve means for capital. A business whose economics depend on short, cheap tasks was already sitting in the flat part of this curve. The steep part covers work measured in hours and days, which is most professional work. Pricing a service against today's cost of a full day of machine labor means pricing against a number that has been falling by roughly two thirds a year, and the direction of that error is always the same.
How much has the cost of AI work fallen since 2023?
A fifteen minute job fell from about $25 to $0.70, roughly 35 times cheaper. An hour fell from $301 to $3.57, about 84 times. A four hour job fell from $4,100 to $20, about 209 times. A full day fell from $15,600 to $51, about 305 times, using the cheapest model available from any vendor.
Chart data: How many times cheaper it became to complete a job with AI between 2023 and 2026, by job length, using the cheapest model available from any vendor.
Period
2023 through 2026
Plotted
15-minute job, 1-hour job, 4-hour job, Full day of work
Source
Early Riders, AI Efficiency Gains: The Collapsing Cost of Useful Output.
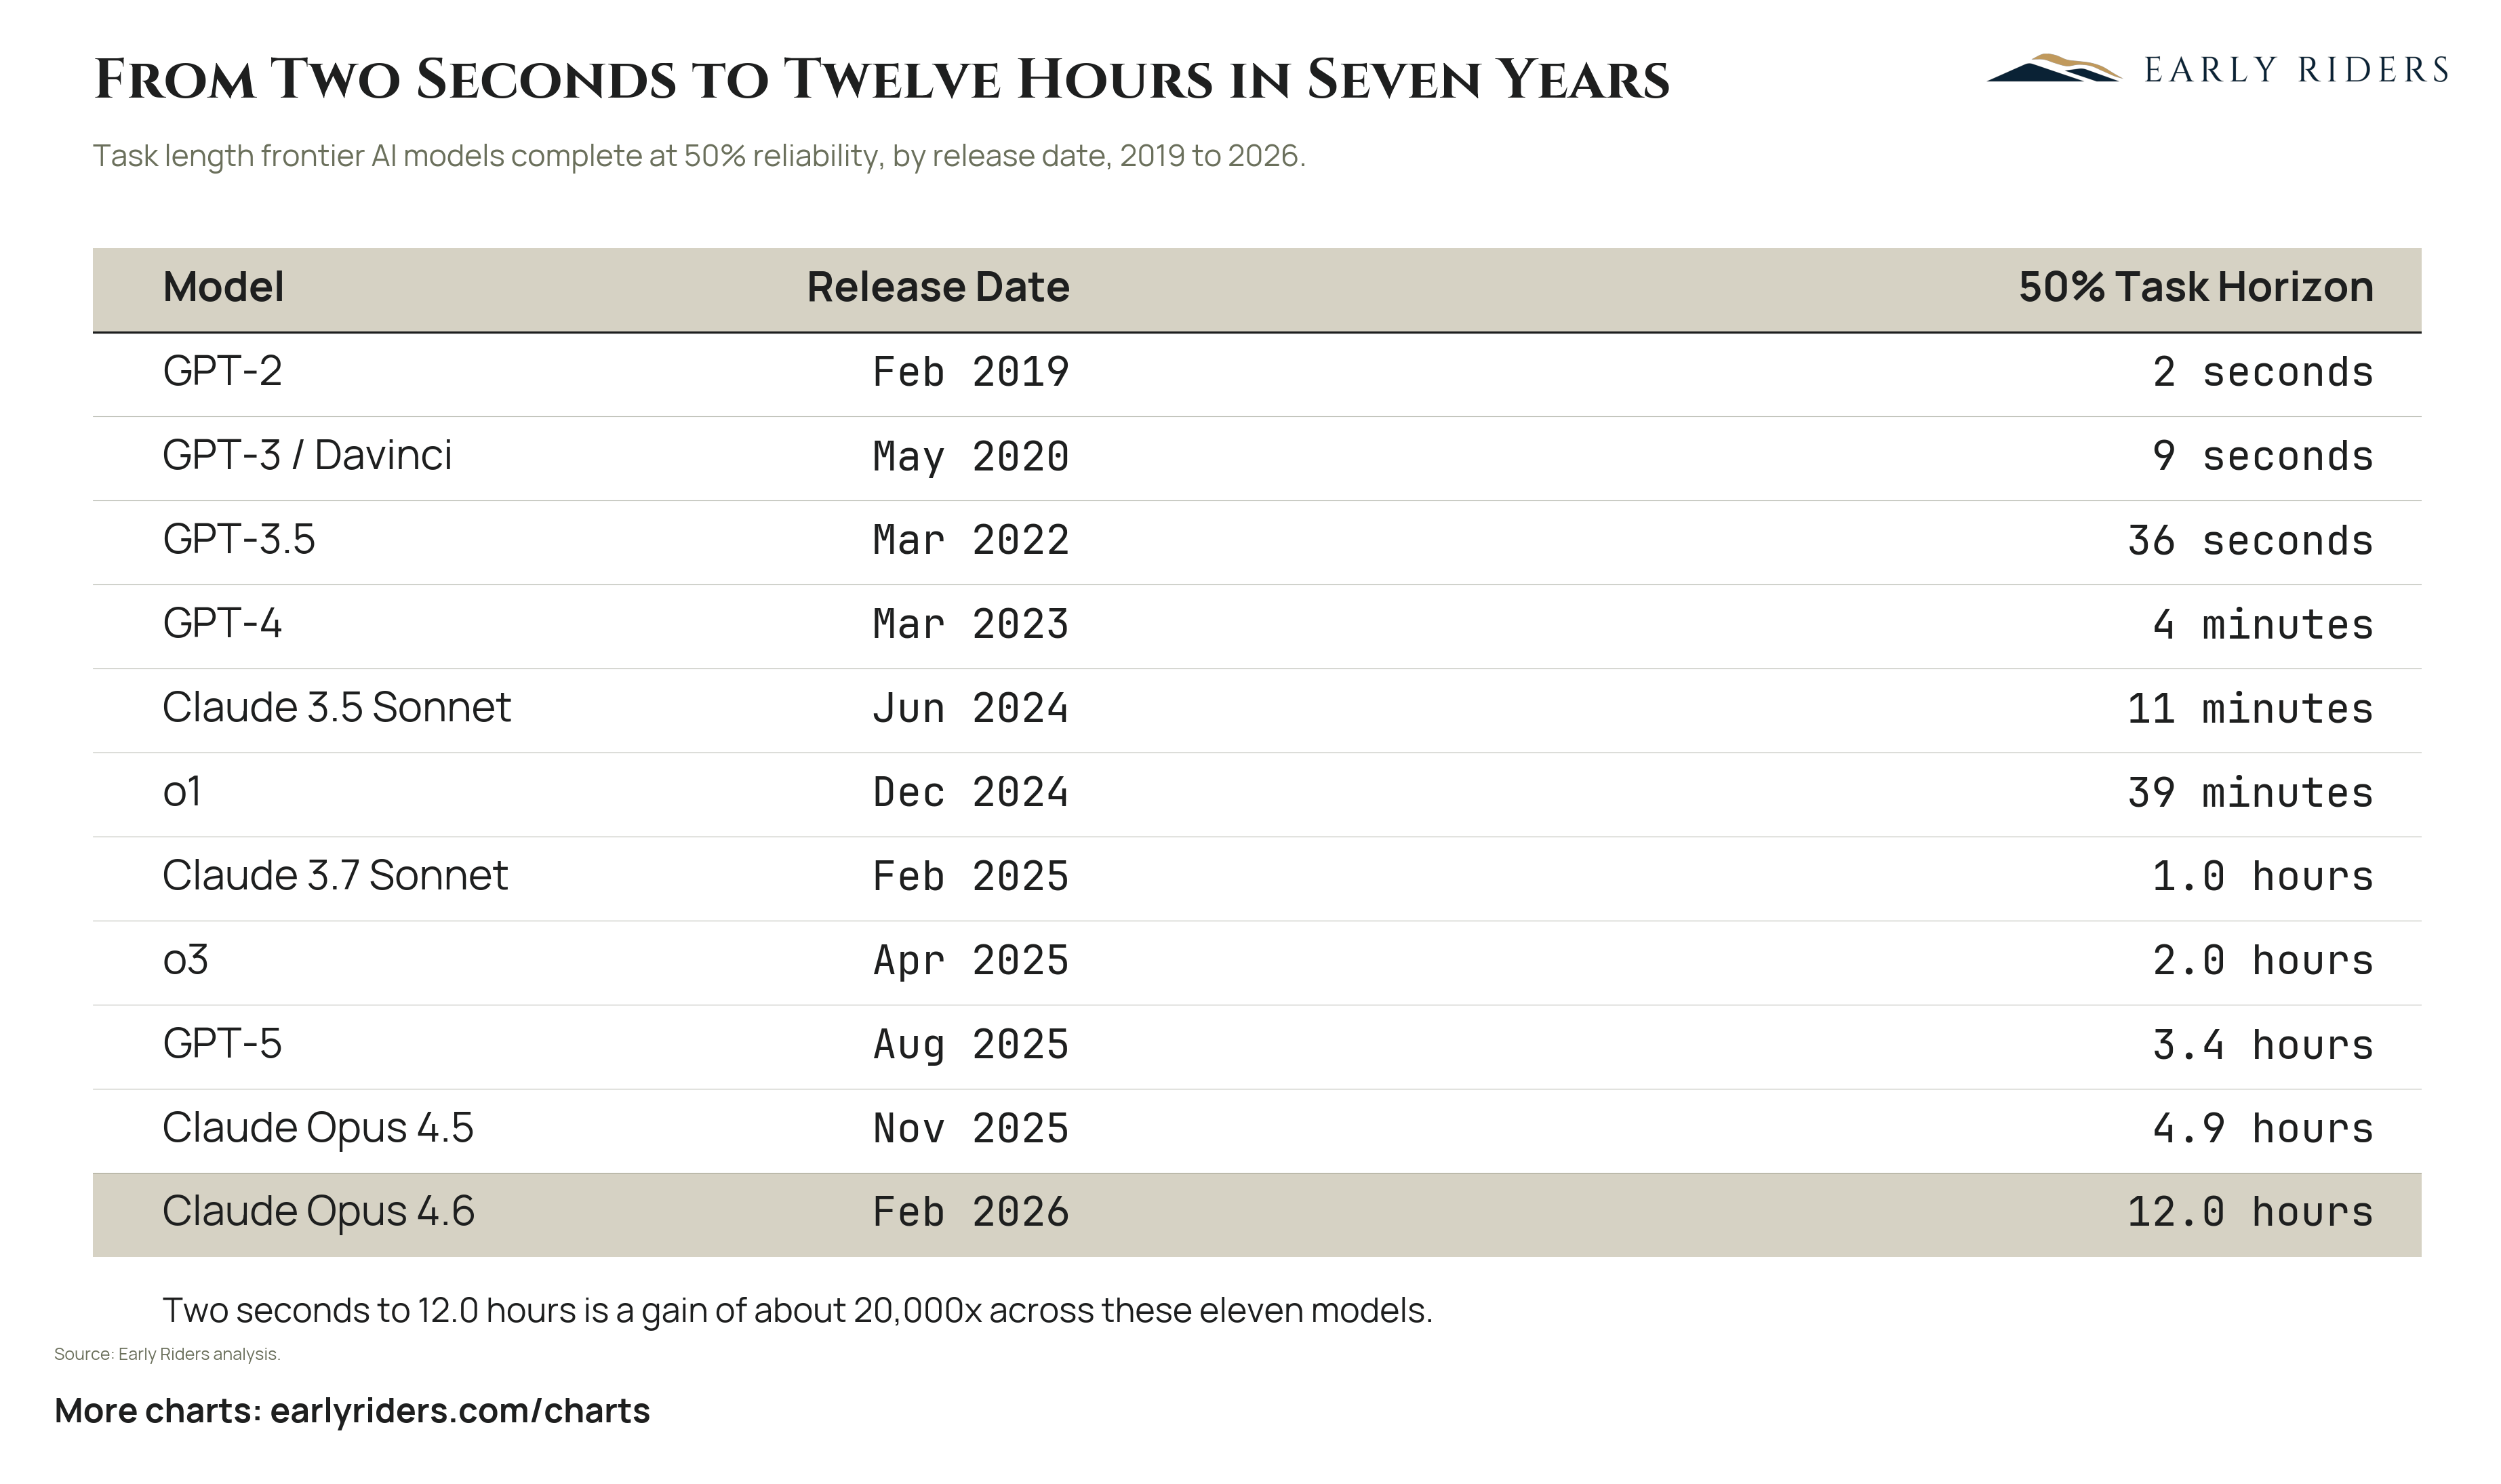
The length of task a frontier AI model can complete at 50% reliability grew from 2 seconds in 2019 to 12 hours in 2026, a gain of about 20,000x.
The metric here is the length of task a frontier model finishes with 50% reliability, so it measures delegation rather than benchmark scores. GPT-2 managed 2 seconds in February 2019. GPT-3 reached 9 seconds in May 2020, and GPT-3.5 hit 36 seconds in March 2022. GPT-4 broke into minutes at 4 in March 2023, Claude 3.5 Sonnet reached 11 minutes in June 2024, and o1 reached 39 minutes that December.
The hour barrier fell in February 2025 with Claude 3.7 Sonnet at 1.0 hour. From there the frontier ran to o3 at 2.0 hours in April 2025, GPT-5 at 3.4 hours in August, Claude Opus 4.5 at 4.9 hours in November, and Claude Opus 4.6 at 12.0 hours in February 2026. That final step more than doubled the horizon in three months. Across these eleven models the gain is about 20,000x. The figures are Early Riders analysis.
A two-second horizon is autocomplete. A twelve-hour horizon is a full workday of delegated work handed off in the evening and collected in the morning, which turns AI from a software line item into a labor substitution question. If the cadence of the past year holds, the binding constraint stops being model capability and becomes the compute and electricity required to run it.
How long a task can AI models complete on their own?
Frontier models now complete tasks of about 12 hours at 50% reliability, measured on Claude Opus 4.6 in February 2026, up from 2 seconds for GPT-2 in February 2019. That is roughly a 20,000x gain across eleven models in seven years, per Early Riders analysis.
Chart data: Task length frontier AI models complete at 50% reliability, by release date, 2019 to 2026.
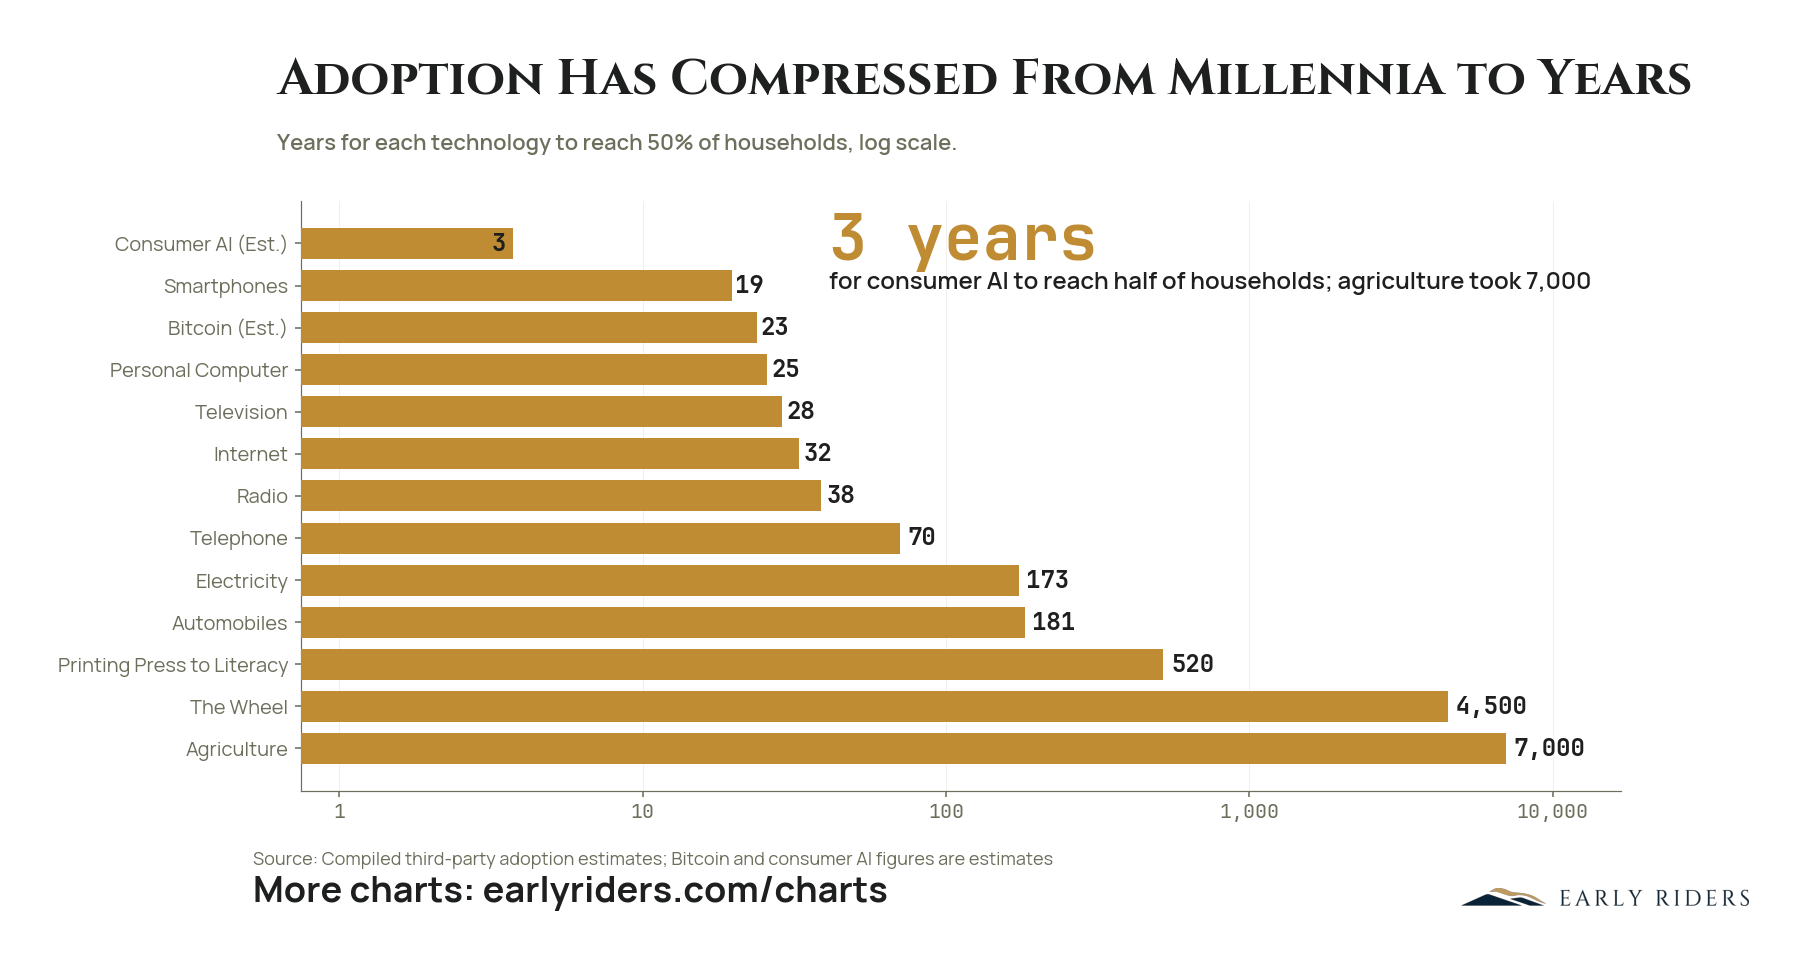
The time a new technology needs to reach half of all households has collapsed from roughly 7,000 years for agriculture to an estimated three years for consumer AI.
Agriculture took about 7,000 years to reach half of households, and the wheel took 4,500. The printing press needed 520 years before literacy reached the same threshold. Electricity took 173 years, automobiles 181, the telephone 70, and radio 38. The pattern tightens sharply in the modern era: television 28 years, the internet 32, the personal computer 25, smartphones 19, Bitcoin an estimated 23, and consumer AI an estimated three. The Bitcoin and consumer AI figures are estimates, and the full series is compiled from third-party adoption research rather than one authoritative dataset. The chart is drawn on a log scale because the range spans four orders of magnitude. For anyone holding or deploying capital, the operative number is not three years but the ratio. A technology that saturates households in three years leaves incumbents almost no time to respond, and it leaves investors almost no time to re-underwrite a position. Diligence built around a decade-long adoption ramp now expires inside a single holding period. That cuts in both directions. It compresses the window in which an early position can be accumulated at a discount, and it compresses the window in which a business you already own can be displaced by something that did not exist at purchase. Position sizing that assumes you will see the disruption coming is no longer safe.
How long does it take a new technology to reach 50% of households?
About three years for consumer AI, against 19 years for smartphones, 32 for the internet, 173 for electricity, and 7,000 for agriculture, all measured as time to reach 50% of households. The figures are compiled third-party adoption estimates; consumer AI and Bitcoin, at 23 years, are estimates.
Chart data: Years for each technology to reach 50% of households, log scale.
Plotted
Consumer AI (Est.), Smartphones, Bitcoin (Est.), Personal Computer, Television, Internet, Radio, Telephone, Electricity, Automobiles, Printing Press to Literacy, The Wheel, Agriculture
Source
Compiled third-party adoption estimates; Bitcoin and consumer AI figures are estimates
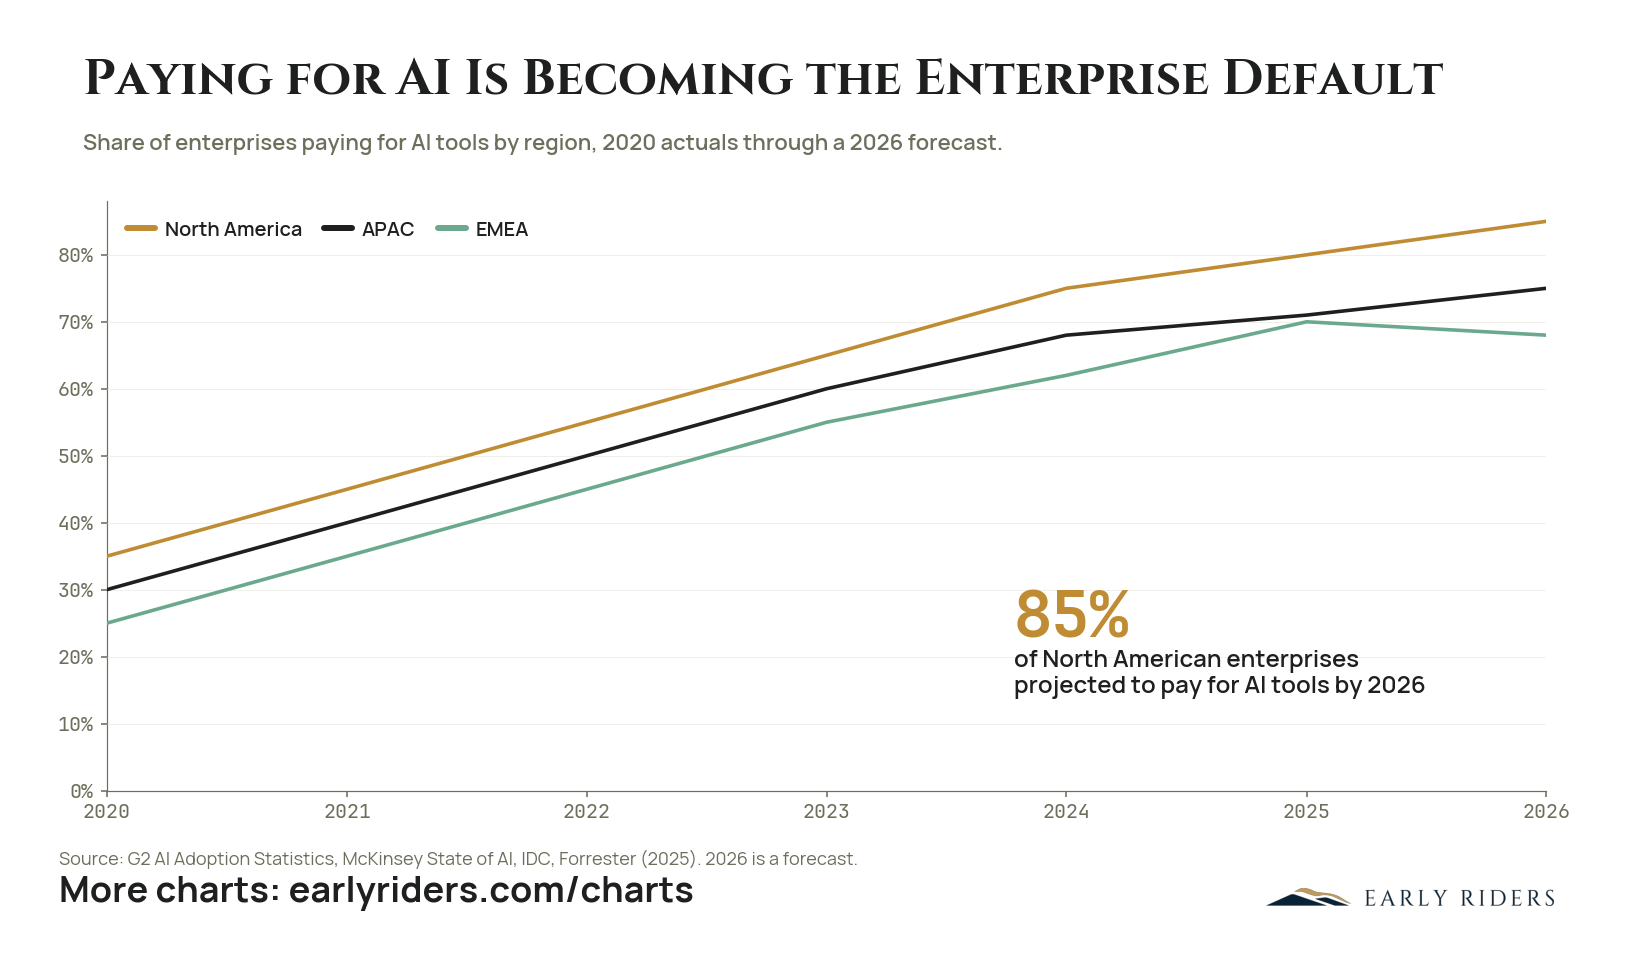
Paid enterprise AI adoption rose from between 25% and 35% of firms in 2020 to a forecast 68% to 85% by 2026 across North America, APAC and EMEA.
In 2020, paying for AI tools was minority behavior: 35% of North American enterprises, 30% in APAC, 25% in EMEA. Six years later the forecast puts North America at 85%, APAC at 75% and EMEA at 68%. The 2026 values are a forecast, and the three regional lines climb at nearly the same slope through 2024, which points to a common adoption curve rather than three regional stories.
The spread between regions stayed narrow. Ten points separated North America from EMEA in 2020, and 17 points separate them in the 2026 forecast, so no region is being left behind. EMEA is the only line that does not rise every year, reaching 70% in 2025 before easing to 68% in 2026.
For capital deployed against AI infrastructure, the useful signal is the composition of that demand rather than its level. Spending that reaches between two-thirds and four-fifths of enterprises has moved into budgets that get renewed and defended in a downturn, which is a different kind of revenue than pilot funding. That makes the base underneath the current build-out sturdier than a spending spike, and it shifts the real risk away from whether enterprises will pay and toward how deep the deployments actually go.
What percentage of enterprises pay for AI tools?
About 85% of North American enterprises are projected to pay for AI tools by 2026, up from 35% in 2020, with APAC at 75% and EMEA at 68%. The 2026 figures are forecasts built on G2, McKinsey, IDC and Forrester data; earlier years are actuals.
Chart data: Share of enterprises paying for AI tools by region, 2020 actuals through a 2026 forecast.
Period
2020 through 2026
Plotted
North America, APAC, EMEA
Source
G2 AI Adoption Statistics, McKinsey State of AI, IDC, Forrester (2025). 2026 is a forecast.
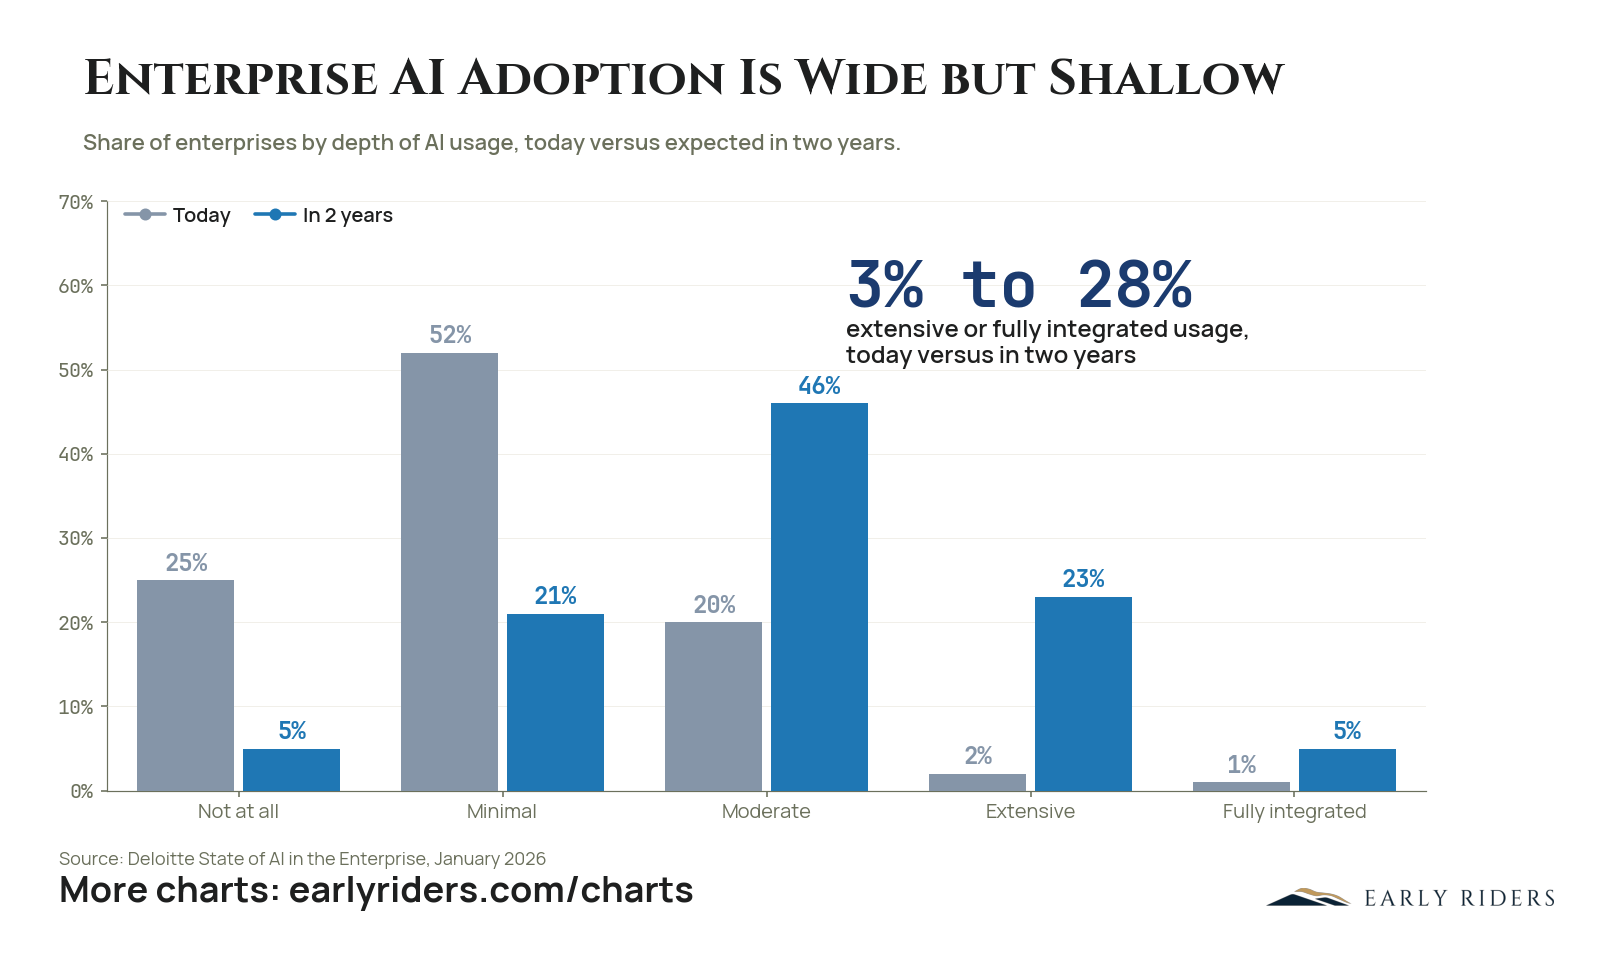
Only 3% of enterprises report extensive or fully integrated AI usage today, against 28% expected within two years, so most adoption so far is shallow.
Deloitte's January 2026 survey puts 52% of enterprises at minimal AI usage and another 25% at none at all. Moderate usage covers 20%. Extensive usage accounts for 2% and fully integrated for 1%, which means 3% of enterprises have pushed AI past the pilot stage and into the core of how they operate.
Respondents expect that to change quickly. Two years out, the same firms put 46% at moderate, 23% at extensive and 5% at fully integrated, while "not at all" falls from 25% to 5% and minimal drops from 52% to 21%. Those are stated expectations rather than measured outcomes, and survey respondents routinely overstate their own forward plans.
The distinction matters to anyone underwriting AI's economic effect. Headline adoption numbers count firms that bought a license. This one counts firms that changed how work gets done, and by that measure the installed base today is 3%. Productivity gains, labor displacement and the earnings revisions that follow all sit on the right-hand side of this survey rather than the left. Whether that 28% arrives on schedule is the variable that decides whether today's capital build-out looks early or overbuilt.
How many companies have fully integrated AI into their operations?
Just 3% of enterprises report extensive or fully integrated AI usage today, versus 28% expected within two years, according to Deloitte's January 2026 State of AI in the Enterprise survey. Most current adoption is minimal at 52% or moderate at 20%, and the two-year number is a stated expectation.
Chart data: Share of enterprises by depth of AI usage, today versus expected in two years.
Period
today versus expected in two years
Plotted
Today, In 2 years, across Not at all, Minimal, Moderate, Extensive, Fully integrated
Source
Deloitte State of AI in the Enterprise, January 2026
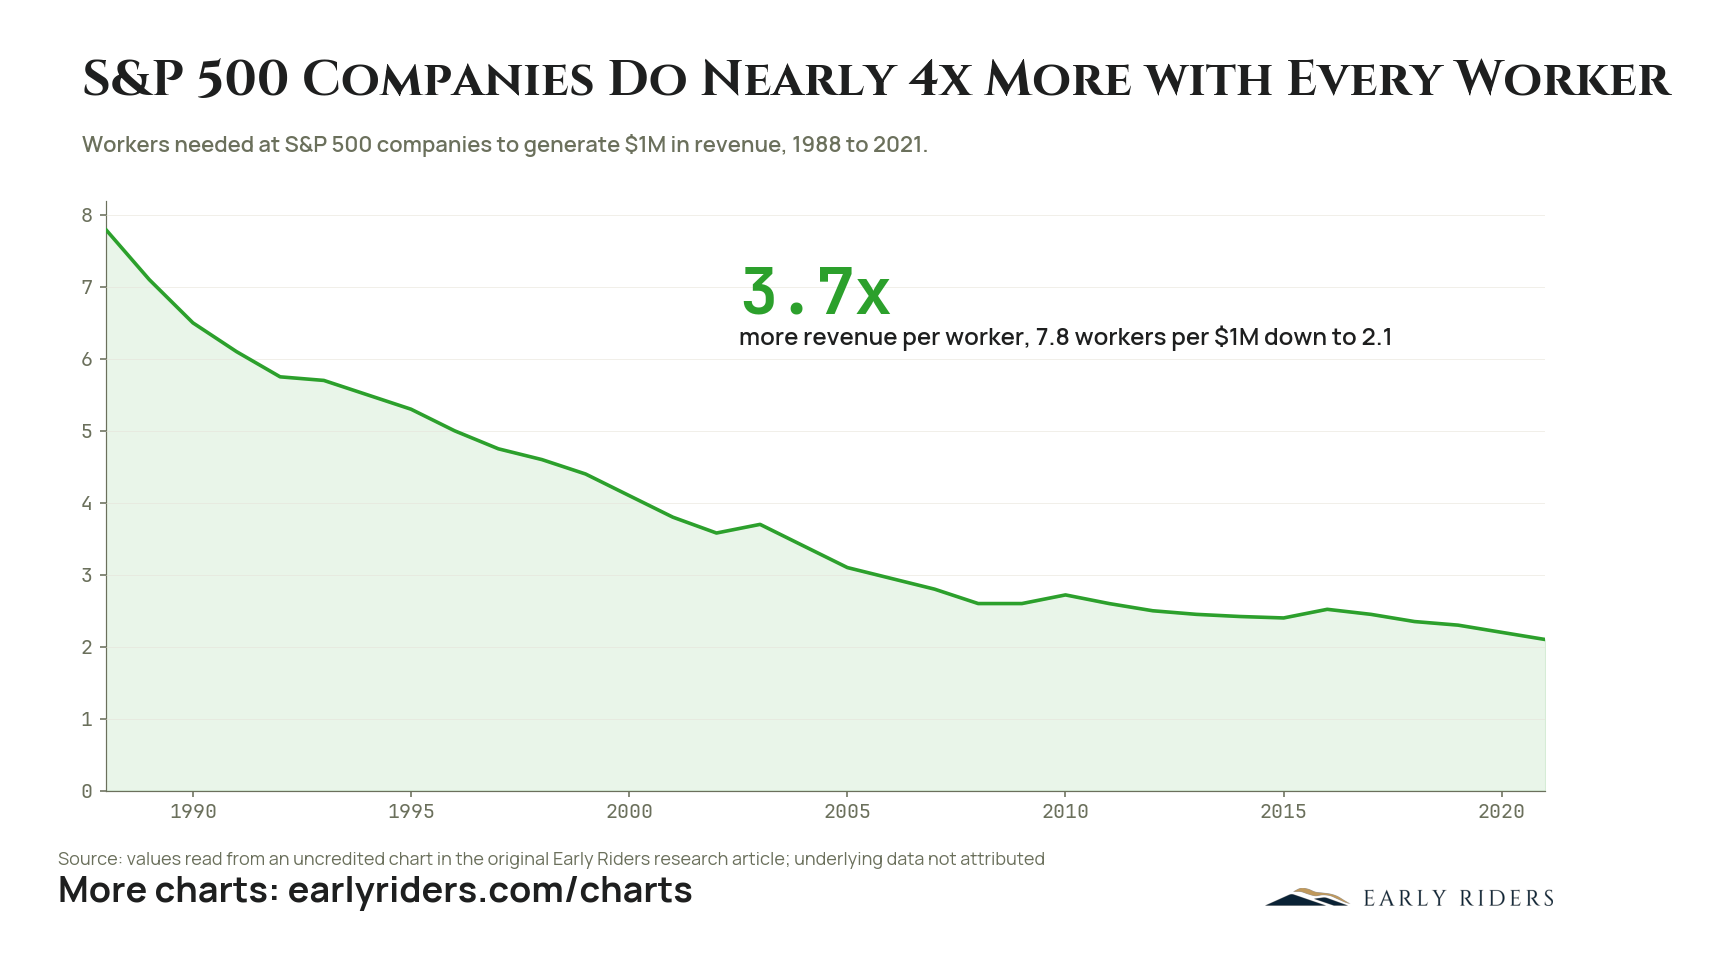
It took 7.8 workers at the average S&P 500 company to produce $1 million of revenue in 1988 and only 2.1 by 2021, a 3.7x gain in output per employee.
In 1988 the average S&P 500 company needed 7.8 workers to generate $1 million of revenue. By 2021 it needed 2.1. That is 3.7 times more revenue per employee, and it did not arrive in a single leap. The figure falls to roughly 5.3 by 1995, to about 4.1 by 2000, and to about 2.6 by 2008, with only brief reversals in 2003, 2010 and 2016 when revenue softened faster than headcount. After 2008 the curve flattens in a narrow band between 2.1 and 2.6, which suggests the large gains from software, automation and global sourcing were mostly booked before the last decade began. The implication for anyone holding equity risk is that corporate earnings are increasingly a claim on installed technology rather than on labor. Payroll is a shrinking share of what it takes to produce a dollar of sales, so the return accrues to whoever owns the capital and the code. It also means the next leg of margin expansion has to come from somewhere other than the same trend, because a decade of flat readings says this particular lever is close to exhausted. Figures here were read from a chart in the original Early Riders research article, which did not attribute the underlying dataset.
How many employees does it take an S&P 500 company to generate $1 million in revenue?
About 2.1 workers as of 2021, down from 7.8 in 1988. That is a 3.7x improvement in revenue per employee across S&P 500 companies over 33 years, with most of the gain accumulated before 2008 and the figure holding between 2.1 and 2.6 since.
Chart data: Workers needed at S&P 500 companies to generate $1M in revenue, 1988 to 2021.
Period
1988 to 2021
Plotted
Workers per $1M revenue
Source
values read from an uncredited chart in the original Early Riders research article; underlying data not attributed
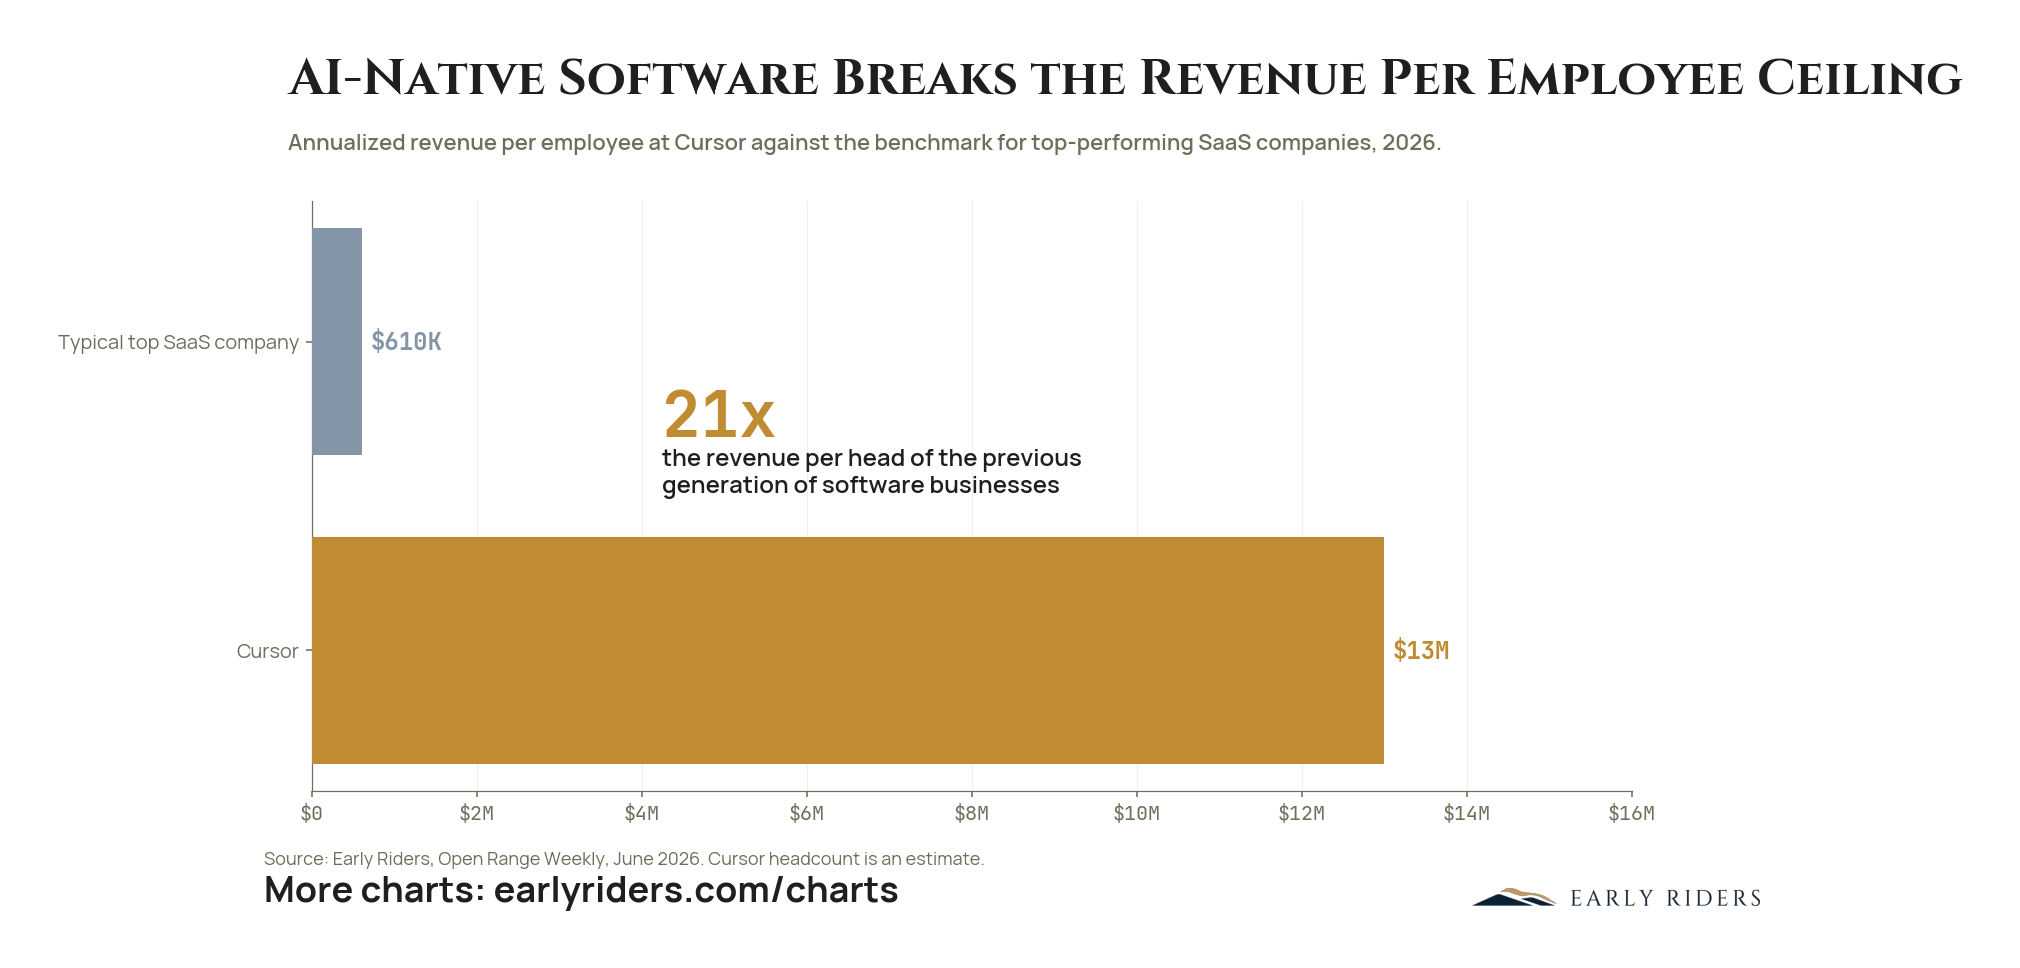
Cursor generates about $13 million of revenue per employee against roughly $610,000 at a typical top-performing SaaS company, a gap of about 21 times.
Cursor reached roughly $4 billion in annualized revenue with a team estimated at a few hundred people, which works out to about $13 million of revenue per employee. The benchmark for a top-performing SaaS company sits near $610,000. The AI-native business is running at roughly 21 times the revenue per head of the generation it is displacing.
Two caveats belong on this. Headcount is an estimate rather than a disclosure, and a single company at an early and unusually steep point on its growth curve is not a sector average. Treat the ratio as an order of magnitude rather than a measurement.
Even discounted heavily it describes something the aggregate data cannot yet show. The chart on S&P 500 revenue per worker traces the index average climbing about four times over three decades, which is the slow, economy-wide version of the same force. This is the leading edge of that curve rather than a separate phenomenon. If output per employee at the frontier runs an order of magnitude above the incumbent benchmark, headcount stops working as a proxy for capacity, and the familiar relationship between company size and company output breaks. For anyone valuing software businesses against cost structures driven by headcount, the anchor is moving.
How much revenue per employee does an AI-native company generate?
Cursor reached roughly $4 billion in annualized revenue with an estimated few hundred employees, about $13 million per head. A typical top-performing SaaS company sits near $610,000. That is roughly 21 times the revenue per employee of the previous generation of software businesses.
Chart data: Annualized revenue per employee at Cursor against the benchmark for top-performing SaaS companies, 2026.
Period
2026
Plotted
Typical top SaaS company, Cursor
Source
Early Riders, Open Range Weekly, June 2026. Cursor headcount is an estimate.
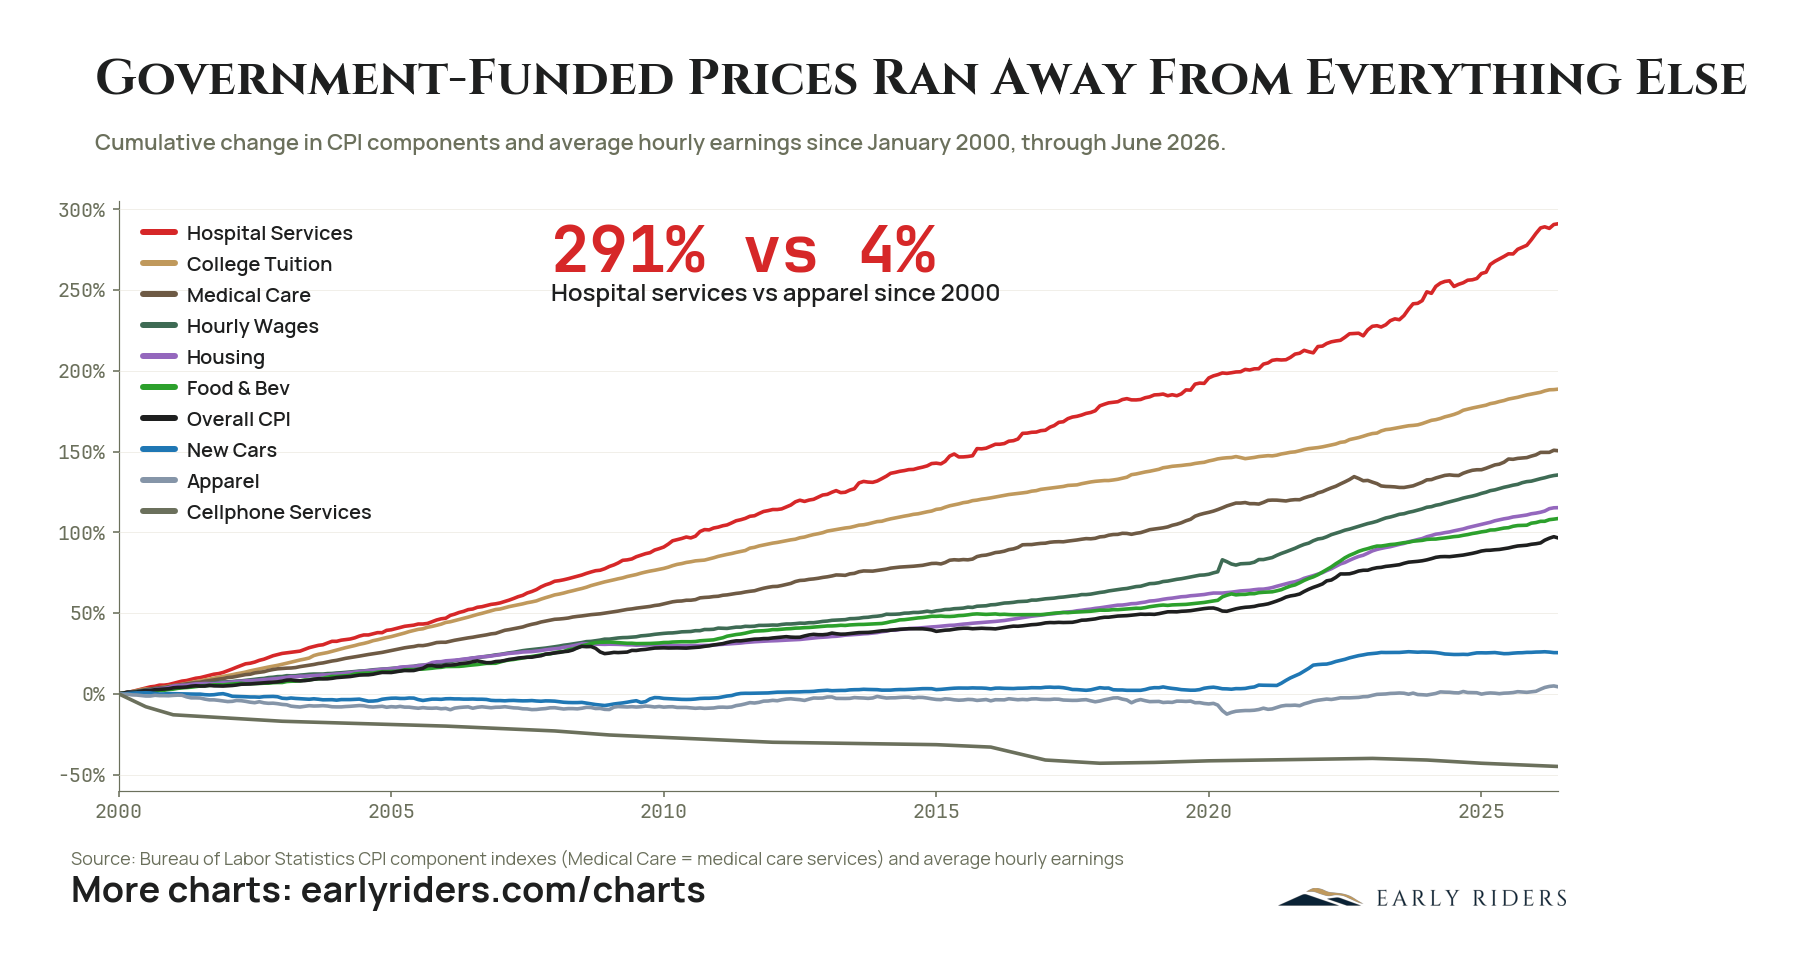
Since January 2000, prices in the most heavily subsidized parts of the American economy have risen several times faster than wages, while goods exposed to competition and trade have barely moved.
Between January 2000 and June 2026, hospital services rose 291% and apparel rose 4%. That gap is the chart. College tuition climbed roughly 199%, medical care services about 150%, and average hourly earnings about 136%. Housing, food and beverages, and the overall CPI all landed below wages, with the headline index up roughly 96% over the same 26 years. On the other side of the ledger, new cars rose only about 25% and cellphone services fell about 45%. Data is from Bureau of Labor Statistics component indexes and average hourly earnings. The dividing line is not goods versus services. It is exposure. Categories insulated by public subsidy, licensure, and third-party payment absorbed price increases that households could not refuse. Categories facing global competition and rapid technological substitution delivered the opposite. Inflation described as a single number obscures this entirely, because the average blends a category that tripled with one that is flat. For someone holding or deploying capital, the practical consequence is that a portfolio benchmarked to headline CPI is benchmarked to the wrong thing. Real spending is concentrated in the categories that nearly quadrupled, not in the ones that have been flat for a generation. The hurdle rate that preserves purchasing power is meaningfully higher than the printed inflation rate implies.
Which prices have risen the most in the US since 2000?
Hospital services, up 291% from January 2000 through June 2026, followed by college tuition at roughly 199% and medical care services at about 150%. Over the same period apparel rose 4%, new cars about 25%, and cellphone services fell about 45%. Source: Bureau of Labor Statistics.
Chart data: Cumulative change in CPI components and average hourly earnings since January 2000, through June 2026.
Period
January 2000 through June 2026
Plotted
Hospital Services, College Tuition, Medical Care, Hourly Wages, Housing, Food & Bev, Overall CPI, New Cars, Apparel, Cellphone Services
Source
Bureau of Labor Statistics CPI component indexes (Medical Care = medical care services) and average hourly earnings
Get Open Range, the weekly Early Riders letter on Bitcoin, AI, and digital asset markets — a front-row seat to the singularity, delivered directly to your inbox.