For most of the nineteenth century money was fixed to gold and prices fell for decades at a time, which was never a crisis: falling prices are simply what rising productivity looks like when the unit of account holds still. We broke that unit, and we are now living through the steepest acceleration in productivity ever recorded. Almost none of it is visible, because it is quoted in a money that shrinks every year. Accelerating progress needs hard money to price it properly.
The Money Broke
Under a gold standard prices drifted down for decades at a time and nobody treated it as a crisis, because that is what rising productivity does to costs when the unit of account holds still. The unit stopped holding still in 1913, and every crisis since has ratcheted the money supply and the debt permanently higher. These charts are what that break did to prices, to the federal budget, and to the cost of capital itself.
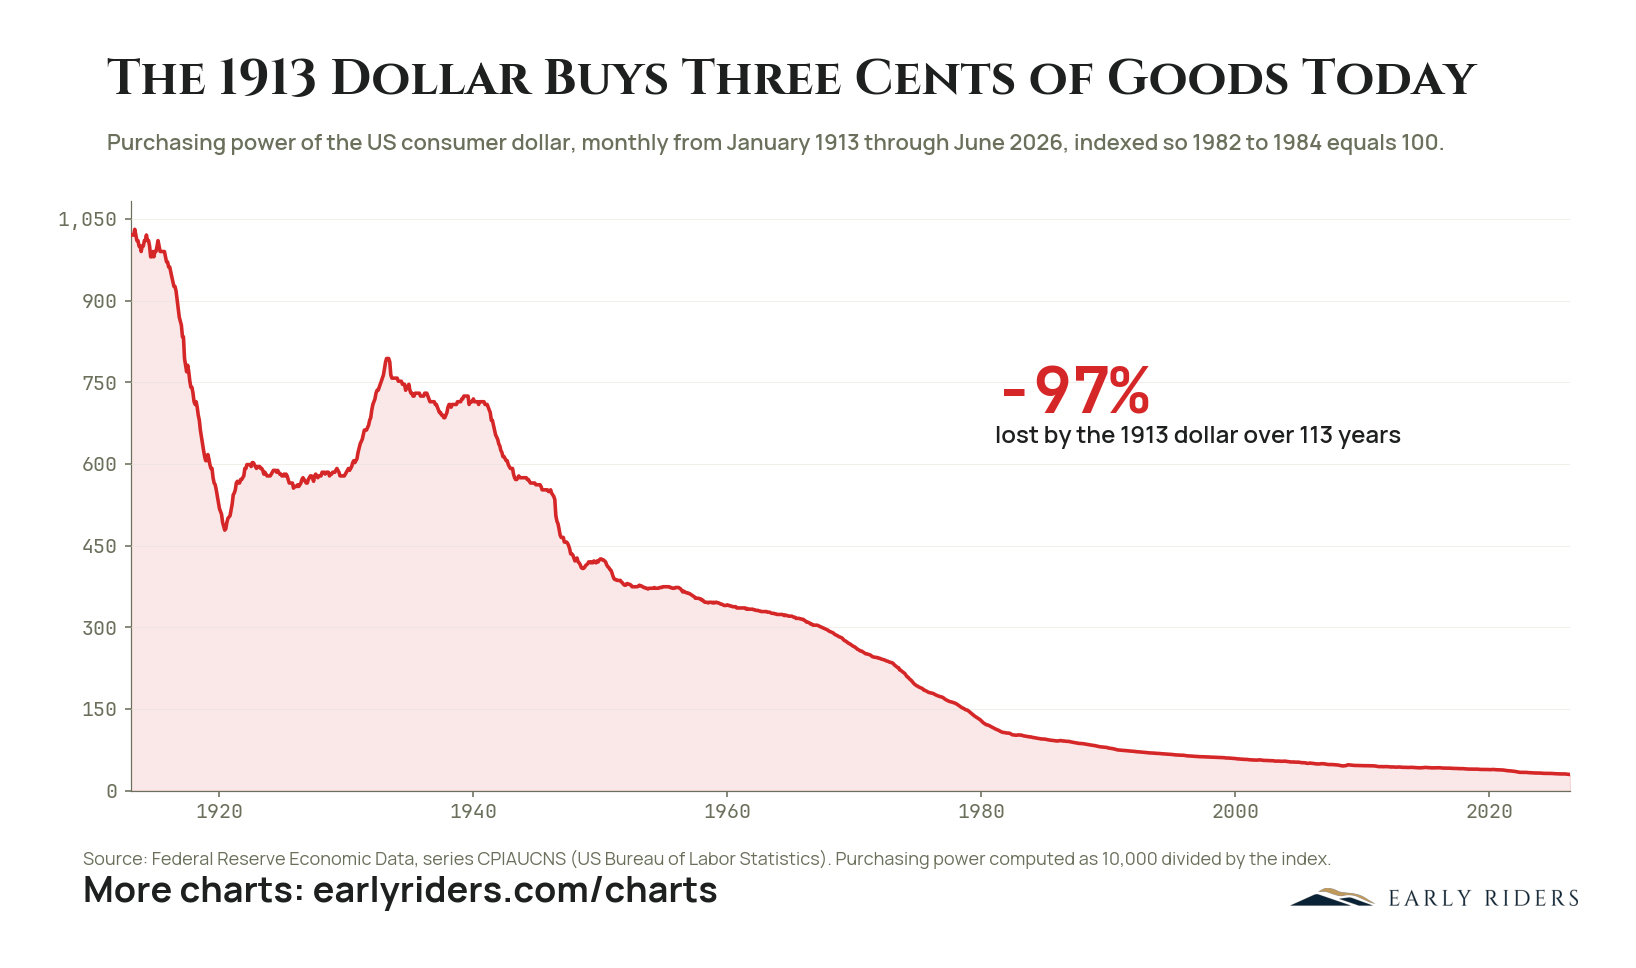
A dollar held since 1913 has lost 97% of its purchasing power, leaving it able to buy about three cents of the goods it once bought.
View all 10 chartsBitcoin Is Better Money
If the problem is a denominator that shrinks, the answer is a denominator that does not. Gold has done that job for four thousand years and central banks are quietly returning to it, but only one money has a supply schedule fully knowable in advance and a security budget that grows with its own price. Measured against that unit rather than against dollars, almost nothing from the last decade holds its value.
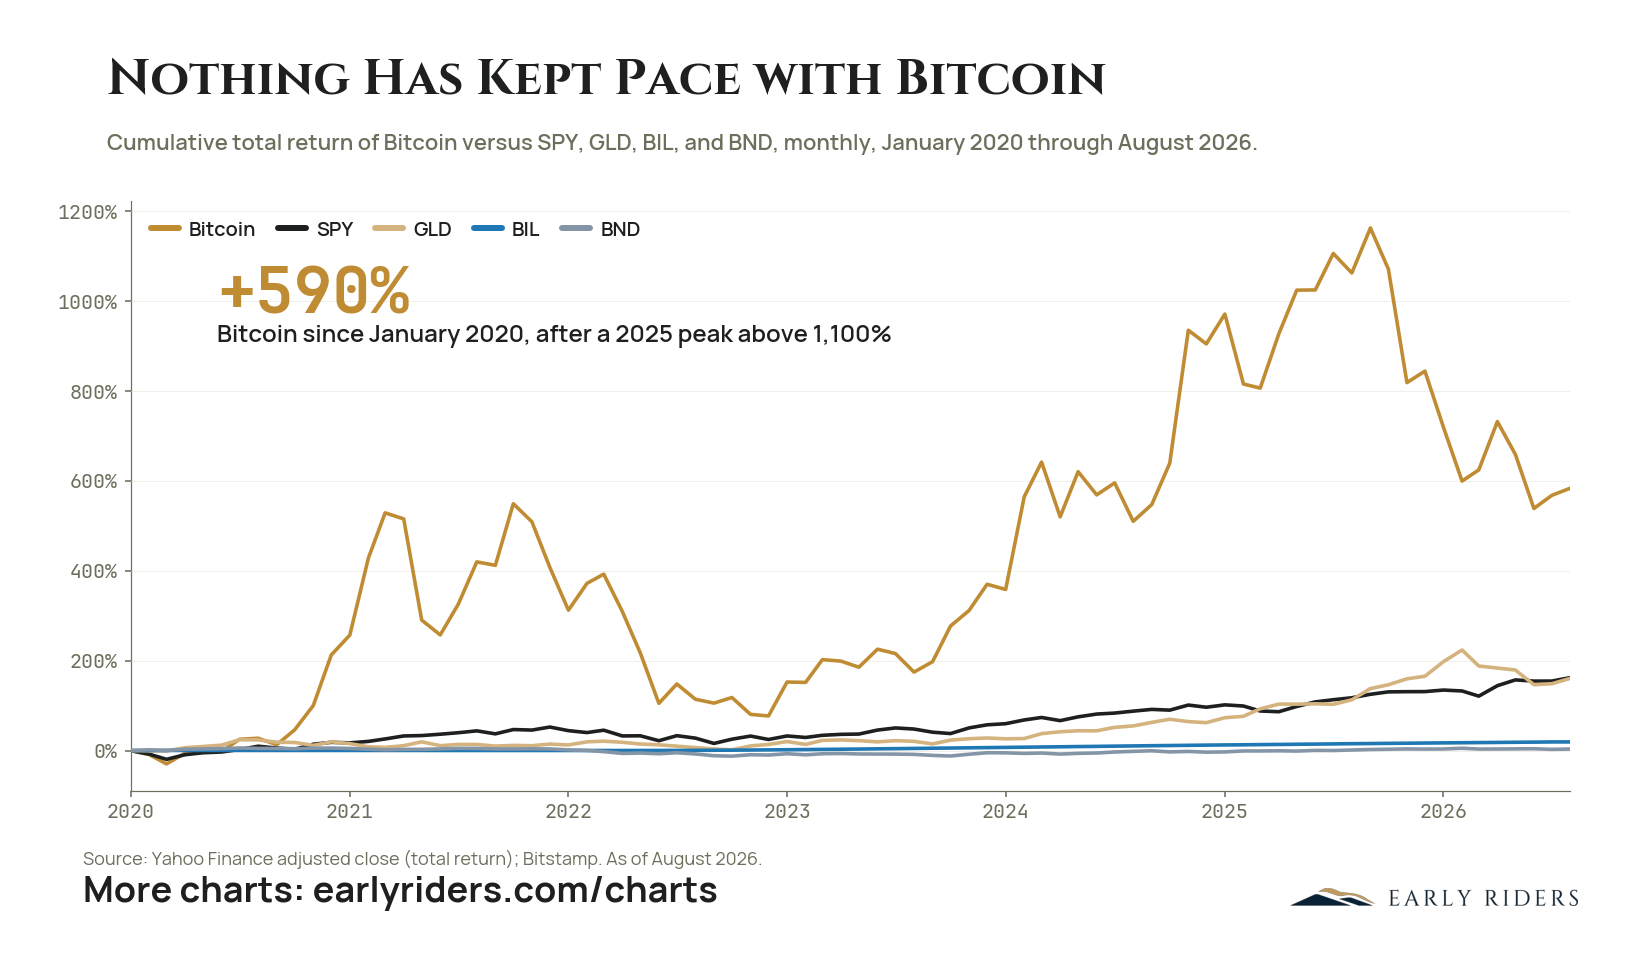
Bitcoin returned about 590% from January 2020 through August 2026, roughly four times what equities or gold delivered and far above the near-zero return on bills and bonds.
View all 11 chartsThe Singularity
Priced properly, the last fifty years are a story of relentless deflation in the cost of doing anything useful, and the rate is still increasing. Compute, inference, and the length of time an autonomous system can work unattended are all improving on curves that bend upward rather than flatten. The one sector running the other way is the one where price is set by policy rather than by production.
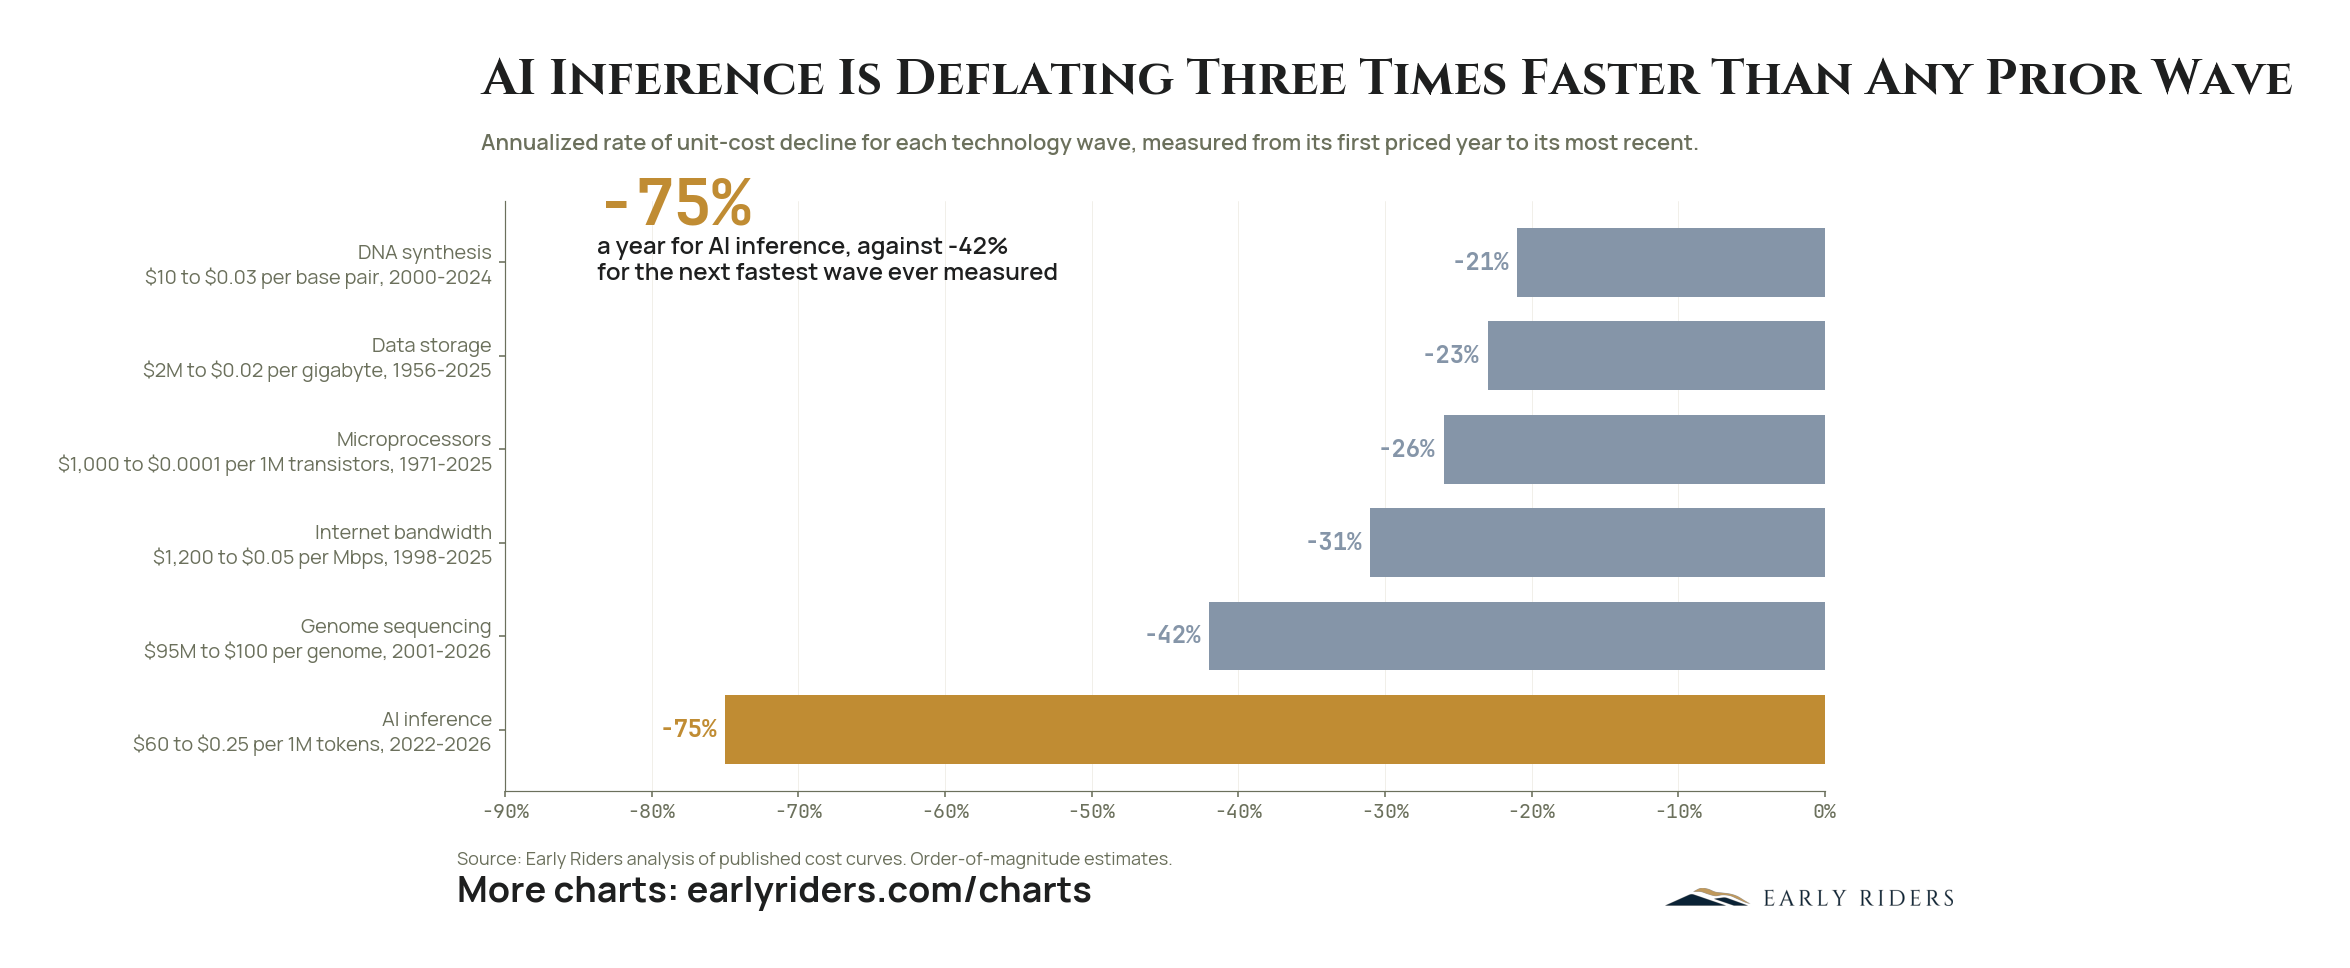
AI inference costs are falling about 75% a year, roughly three times the rate of genome sequencing, the fastest wave previously measured.
View all 11 chartsBitcoin Market Structure
Owning the right asset raises a harder question than which asset, and that is who holds the keys. Individuals still hold the majority of the supply, institutions arrived faster than anyone modeled, and more bitcoin has been lost to key management than to every exchange failure combined. Custody is where a thirty year thesis either survives or does not.
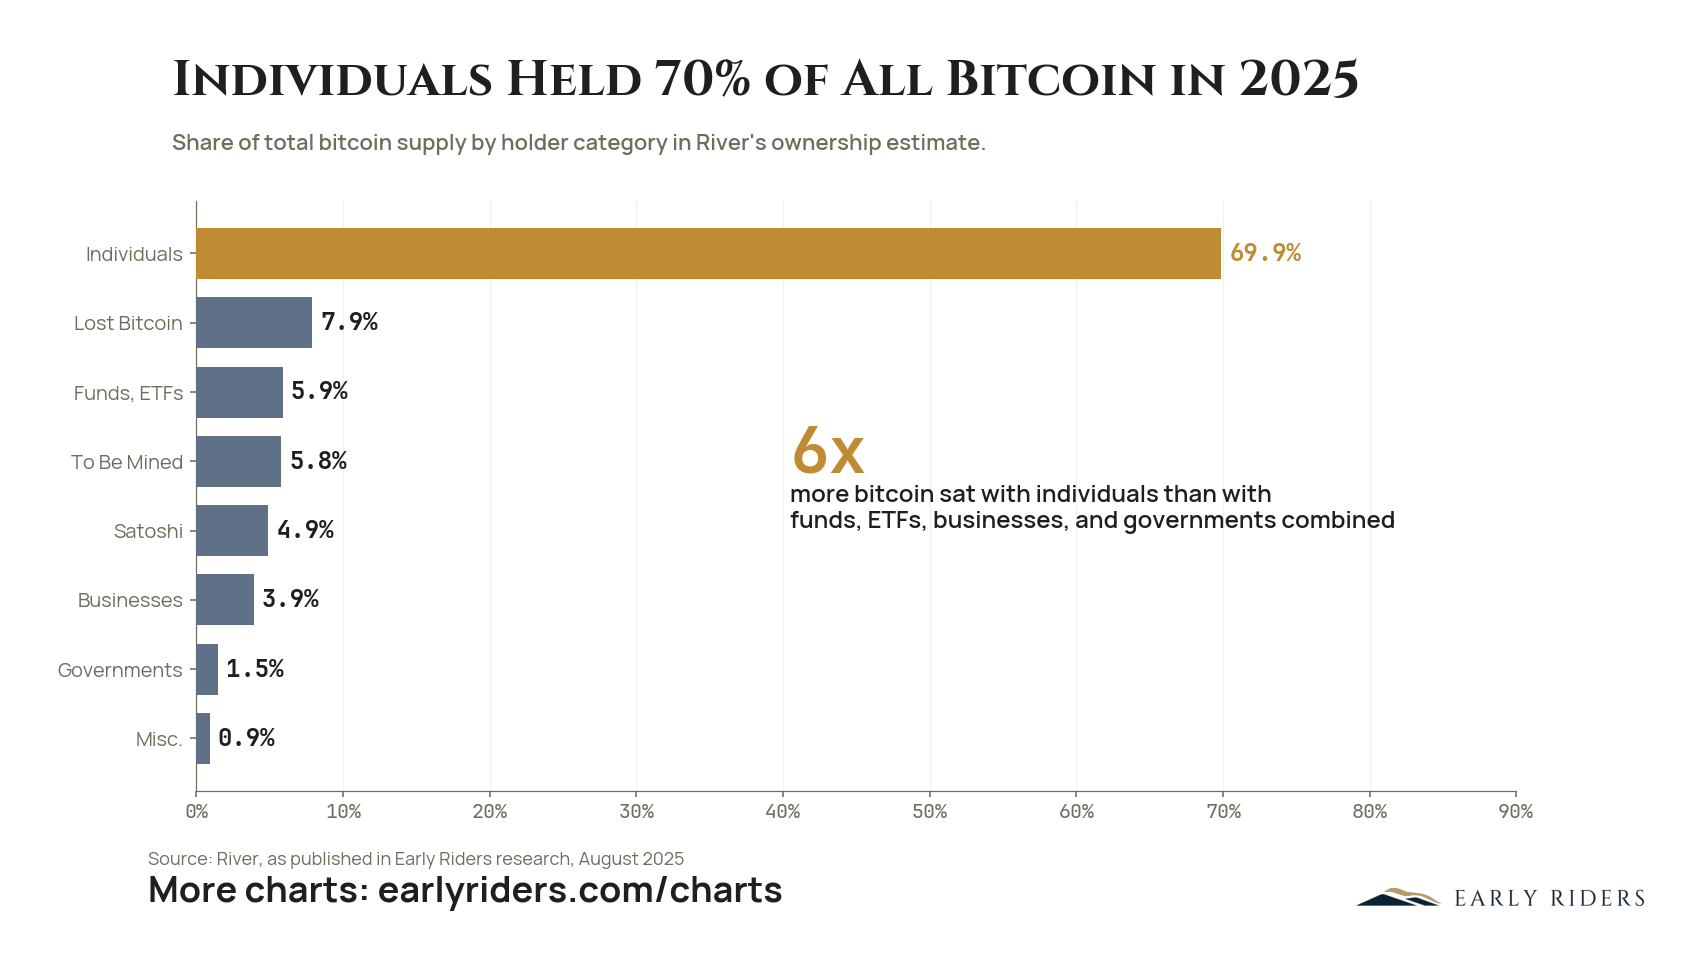
River's 2025 ownership estimate puts 69.9% of all bitcoin in the hands of individuals, about six times what funds, ETFs, businesses and governments hold together.
View all 7 charts