If the problem is a denominator that shrinks, the answer is a denominator that does not. Gold has done that job for four thousand years and central banks are quietly returning to it, but only one money has a supply schedule fully knowable in advance and a security budget that grows with its own price. Measured against that unit rather than against dollars, almost nothing from the last decade holds its value.
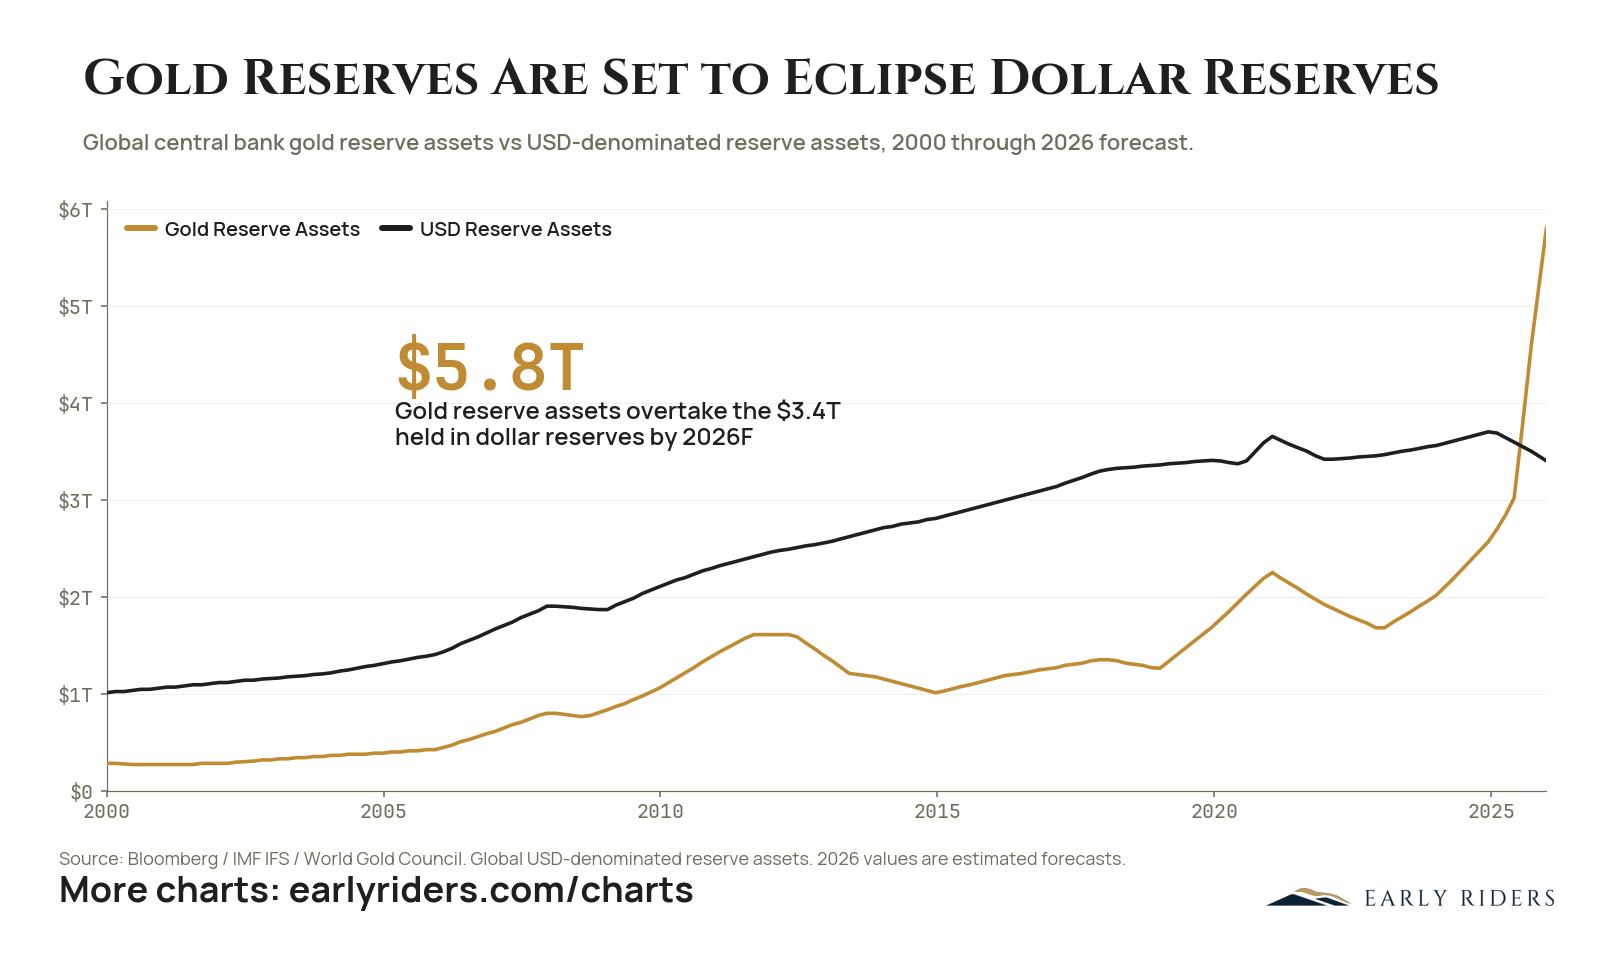
Central bank gold holdings are forecast to reach $5.8T in 2026 against $3.4T in dollar-denominated reserves, the first time gold outweighs the dollar in official reserve assets in this series.
Official reserve managers spent two decades building dollar positions. USD-denominated reserve assets rose from about $1T in 2000 to a peak near $3.7T in 2025. Gold sat below that line the entire time, worth roughly $0.25T in 2000 and still only about $1.6T at its 2012 high, before falling back toward $1.0T by 2015.
The relationship inverts at the end of the series. Gold reserve assets reach about $3T in 2025 and a forecast $5.8T in 2026, while dollar reserves ease to $3.4T. The 2026 values are estimated forecasts rather than reported data, and the final move in the gold line is steep enough that the forecast carries most of the crossing.
What matters is not the precise level but the direction of official demand. Central banks accumulating gold are buying an asset no other government can freeze, dilute, or refuse to settle. That is a reserve preference expressed through balance sheets rather than through speeches, and it is the same property that draws large individual holders to Bitcoin. If sovereign balance sheets are already repricing neutrality, the open question for private capital is what else that repricing has yet to touch.
Do central banks hold more gold or US dollars in their reserves?
Gold reserve assets are forecast at $5.8T in 2026 against $3.4T in dollar-denominated reserves, the first time gold exceeds the dollar in official reserves since 2000, when gold stood near $0.25T versus $1T in dollars. The 2026 values are estimated forecasts, per Bloomberg, IMF IFS and World Gold Council data.
Chart data: Global central bank gold reserve assets vs USD-denominated reserve assets, 2000 through 2026 forecast.
Period
2000 through 2026 forecast
Plotted
Gold Reserve Assets, USD Reserve Assets
Source
Bloomberg / IMF IFS / World Gold Council. Global USD-denominated reserve assets. 2026 values are estimated forecasts.
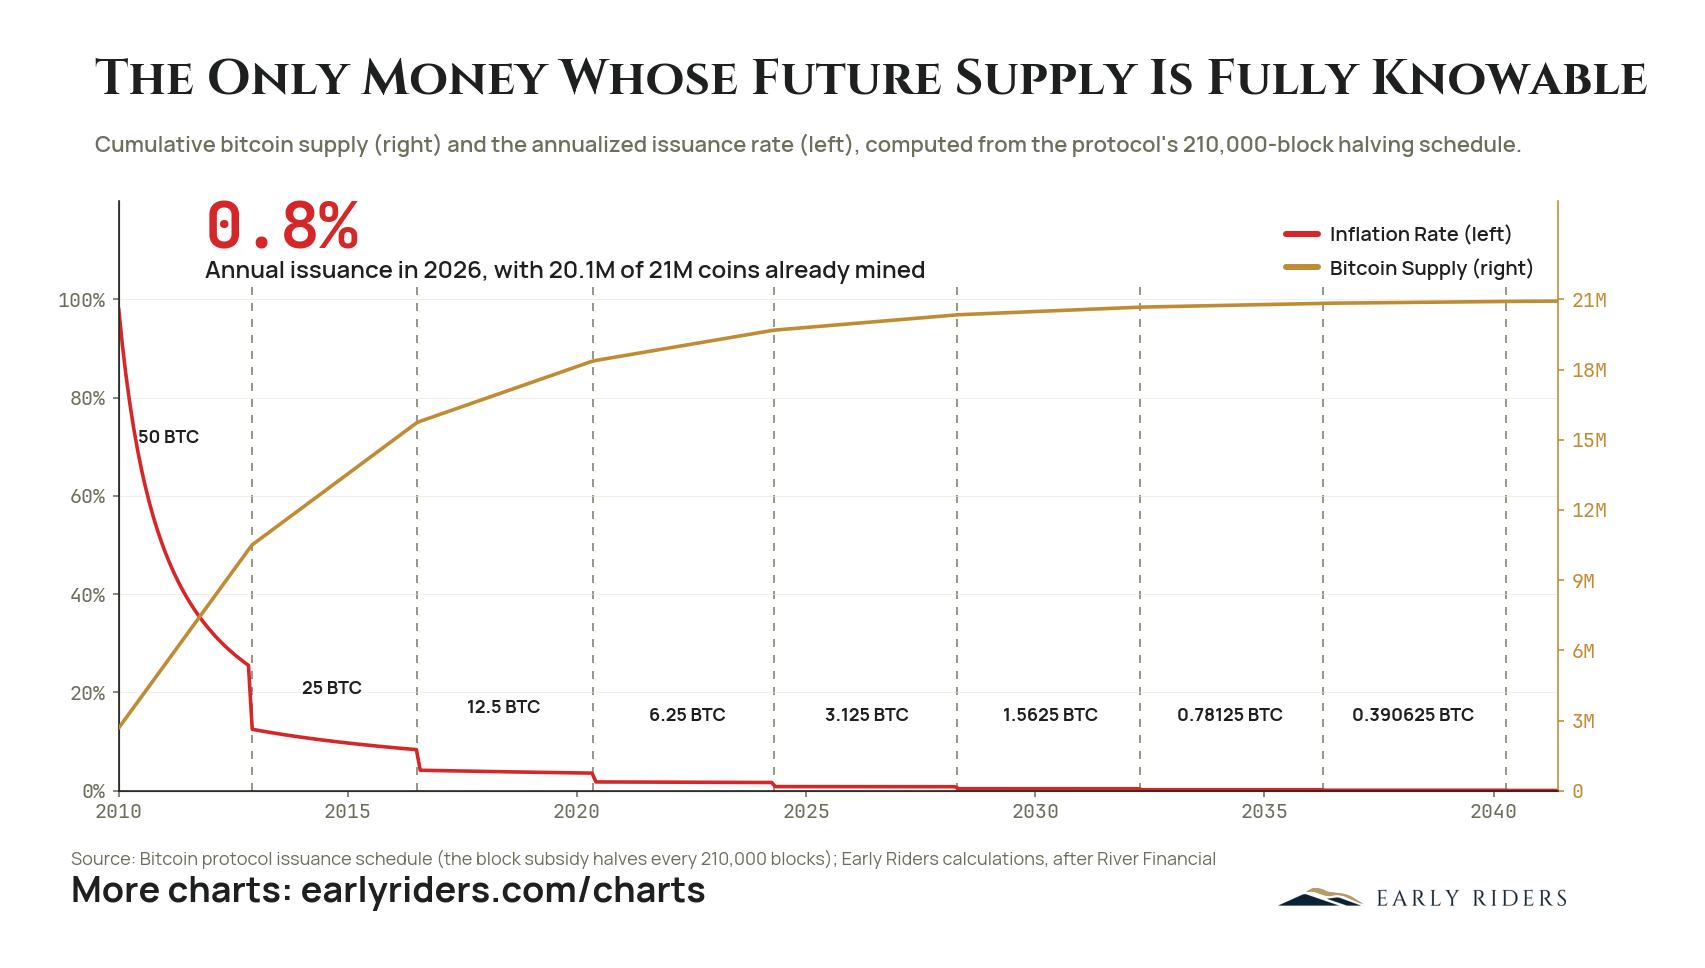
Bitcoin's annual issuance rate drops to 0.8 percent in 2026 with 20.1 million of 21 million coins already mined, and because the halving schedule is written into the protocol, the remaining supply path is known in advance.
Bitcoin's annualized issuance rate falls to 0.8 percent in 2026, with 20.1 million of the eventual 21 million coins already mined. The mechanism is fixed in the protocol: the block subsidy started at 50 BTC and halves every 210,000 blocks, which works out to roughly four years. The chart marks each step, from 50 BTC through 25, 12.5, 6.25, and the current 3.125, then forward to 1.5625 in 2028, 0.78125 in 2032, and 0.390625 in 2036. By 2040 the cumulative supply curve is visually indistinguishable from the 21 million ceiling. Everything to the right of today is a projection and should be read as one. It holds as long as the consensus rules remain unchanged. What separates it from a forecast of gold output or central bank policy is that no estimate of demand, price, or political will enters the calculation. The path is arithmetic. For someone deploying capital, this removes new supply as a variable worth modeling. At 0.8 percent, halving again in 2028, issuance is no longer a seller of any consequence. Price discovery from here is a negotiation among existing holders rather than a contest between buyers and a supply response. Assets whose supply cannot answer a rising price behave differently, and this schedule is the reason to expect that behavior.
What is Bitcoin's inflation rate in 2026?
Bitcoin's annual issuance rate is 0.8 percent in 2026, with 20.1 million of the 21 million total coins already mined. The block subsidy is 3.125 BTC and halves to 1.5625 BTC in 2028 under the protocol's 210,000-block schedule, which makes the entire future supply path knowable in advance.
Chart data: Cumulative bitcoin supply (right) and the annualized issuance rate (left), computed from the protocol's 210,000-block halving schedule.
Period
2010 to 2040
Plotted
Inflation Rate (left), Bitcoin Supply (right)
Source
Bitcoin protocol issuance schedule (the block subsidy halves every 210,000 blocks); Early Riders calculations, after River Financial
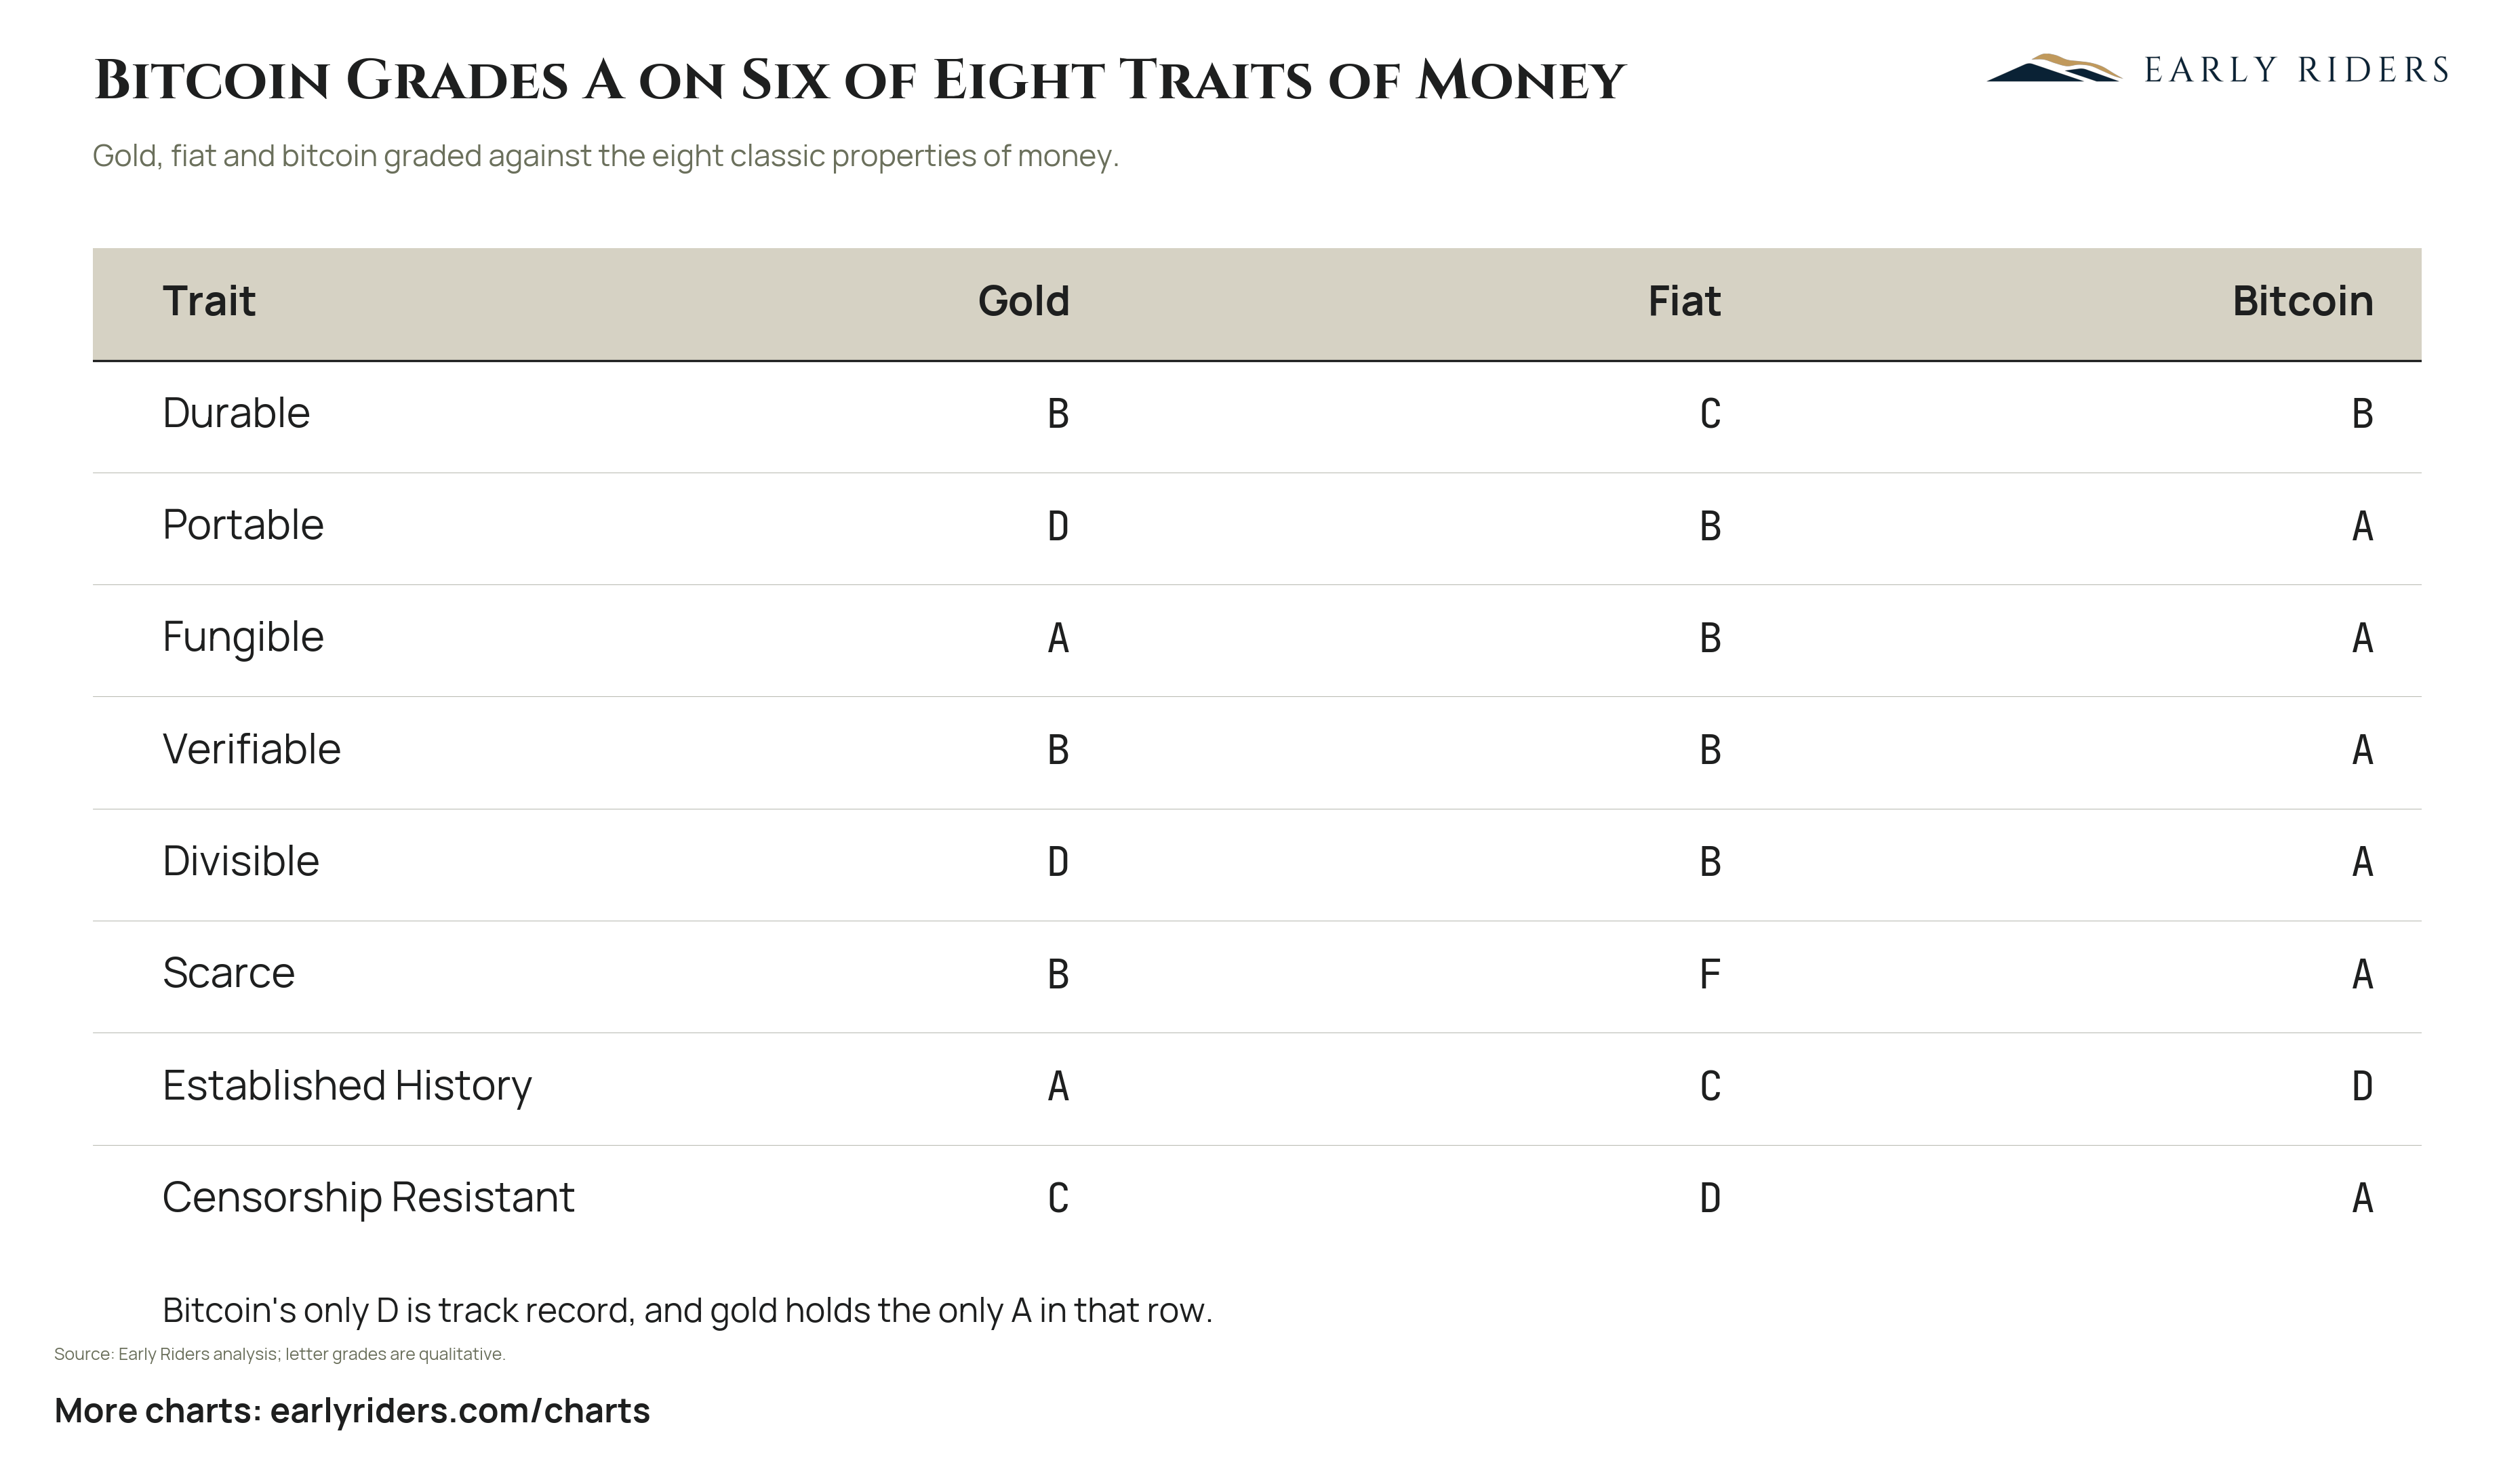
Graded against the eight classic properties of money, Bitcoin earns an A on six, and its only D, established history, is the single row where gold holds the sole A.
The table grades gold, fiat currency, and Bitcoin against the eight properties traditionally used to define money. Bitcoin earns an A on six of them: portable, fungible, verifiable, divisible, scarce, and censorship resistant. It takes a B on durability, matching gold. Its one D is established history, and that is the row where gold holds the only A on the board. Gold's profile is close to the mirror image. It grades A on fungibility and established history, B on durability, scarcity, and verifiability, but D on portability and divisibility, the two properties that made it impractical as a settlement medium once commerce began moving faster than freight. Fiat currency grades B on portability, fungibility, verifiability, and divisibility, C on durability and established history, D on censorship resistance, and F on scarcity, the only failing grade anywhere in the table. The letter grades are qualitative Early Riders analysis rather than a measured index. What the layout makes clear is where the real disagreement sits. Almost nobody argues that Bitcoin is less divisible or less verifiable than the alternatives. The debate reduces to one row: track record. That is also the only property that resolves through the passage of time rather than through engineering or policy, which means the case gets cheaper to defend every year the network keeps running.
How does Bitcoin compare to gold and fiat as money?
Bitcoin grades A on six of the eight classic properties of money: portable, fungible, verifiable, divisible, scarce, and censorship resistant. Its only D is established history, the one row where gold holds the sole A. Fiat's only F is scarcity. The letter grades are qualitative Early Riders analysis.
Chart data: Gold, fiat and bitcoin graded against the eight classic properties of money.
Plotted
Trait, Gold, Fiat, Bitcoin
Source
Early Riders analysis; letter grades are qualitative.
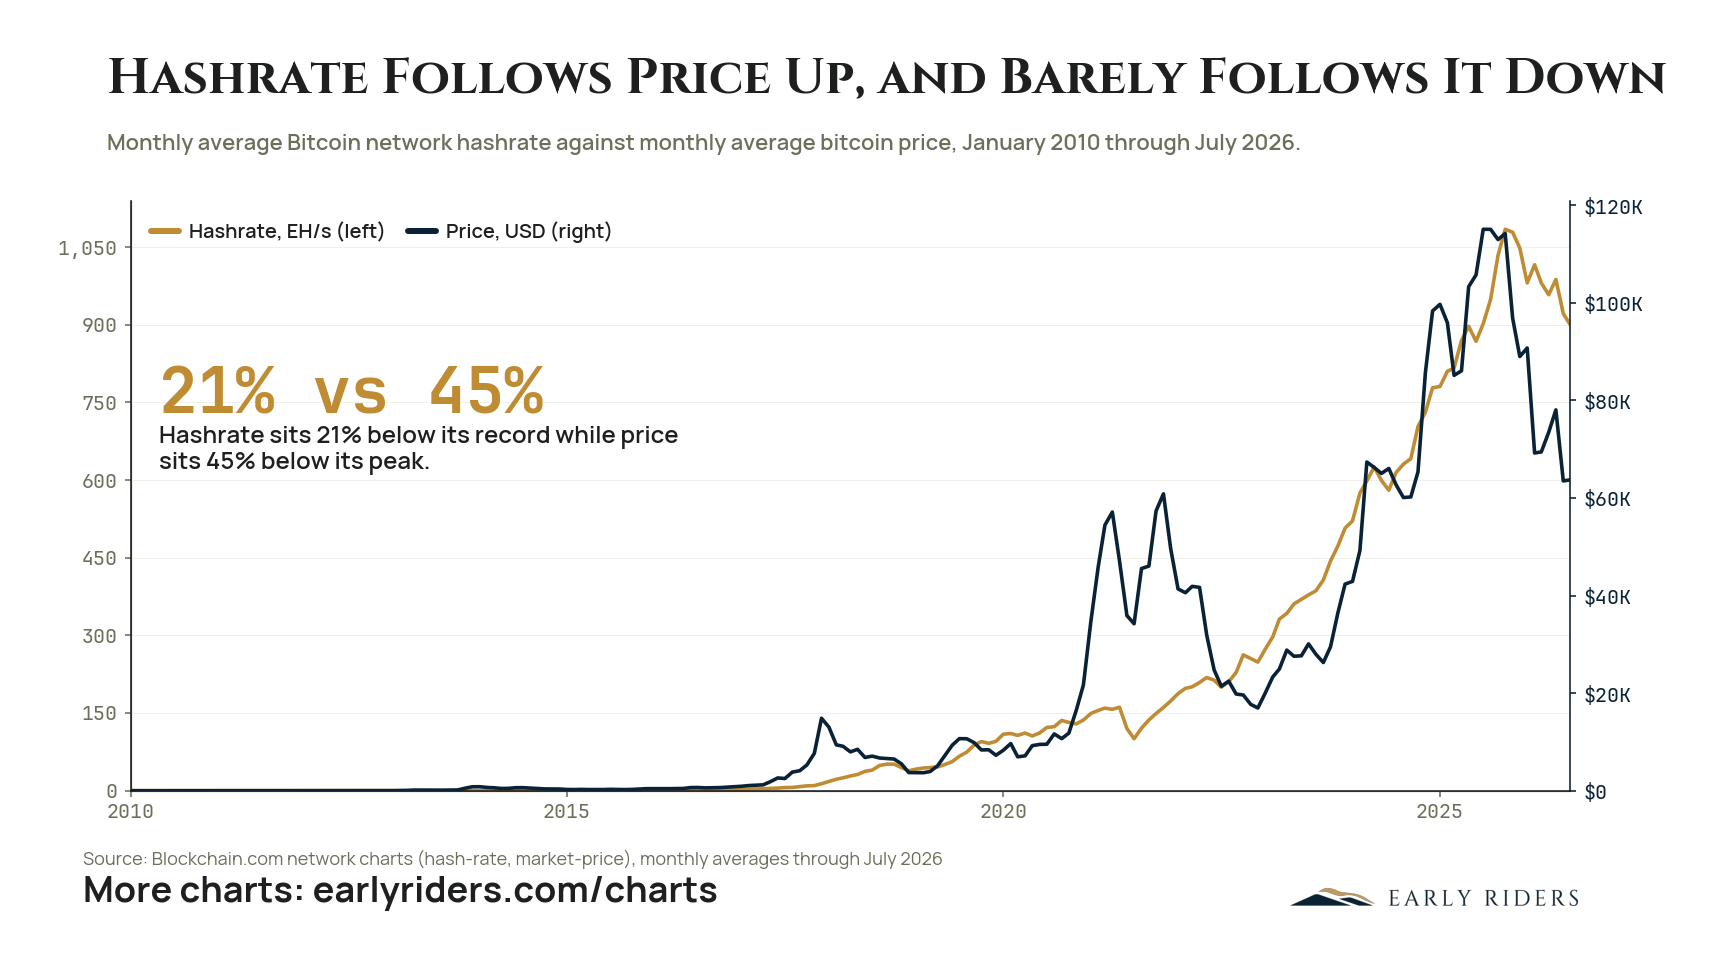
Bitcoin's price sits 45% below its August 2025 high while the computing power securing the network is down only 21% from its November 2025 record, the same asymmetry that has followed every previous drawdown.
As of July 2026, bitcoin's monthly average price was $63,073, some 45% below the August 2025 peak of $114,868. Network hashrate over the same month averaged 897.9 EH/s, only 21% below its November 2025 record of 1,136.9 EH/s. Price fell roughly twice as far as the capacity securing the chain.
That gap is structural rather than coincidental. Mining capacity is bought with committed capital: machines are ordered months ahead, power contracts run for years, and a facility that is already built keeps running as long as revenue covers marginal electricity cost. Price can reprice in an afternoon; a hosting agreement cannot. The result is a ratchet. Hashrate rises quickly when margins expand and gives back only a fraction of the gain when they compress, which is why the trough after each drawdown has sat well above the prior cycle's peak.
For anyone holding the asset, this is the cleanest available read on operator conviction. The people with the least liquid, most irreversible exposure to bitcoin's future price are not withdrawing capacity at anything like the rate the market has withdrawn its bid.
The market repriced the asset. The people who build the infrastructure largely did not.
Does bitcoin hashrate fall when the price falls?
Hashrate falls far less than price. In July 2026 bitcoin's hashrate averaged 897.9 EH/s, 21% below its November 2025 record of 1,136.9 EH/s, while price averaged $63,073, 45% below its August 2025 peak of $114,868. Mining capacity is committed capital, so it contracts slowly.
Chart data: Monthly average Bitcoin network hashrate against monthly average bitcoin price, January 2010 through July 2026.
Period
January 2010 through July 2026
Source
Blockchain.com network charts (hash-rate, market-price), monthly averages through July 2026
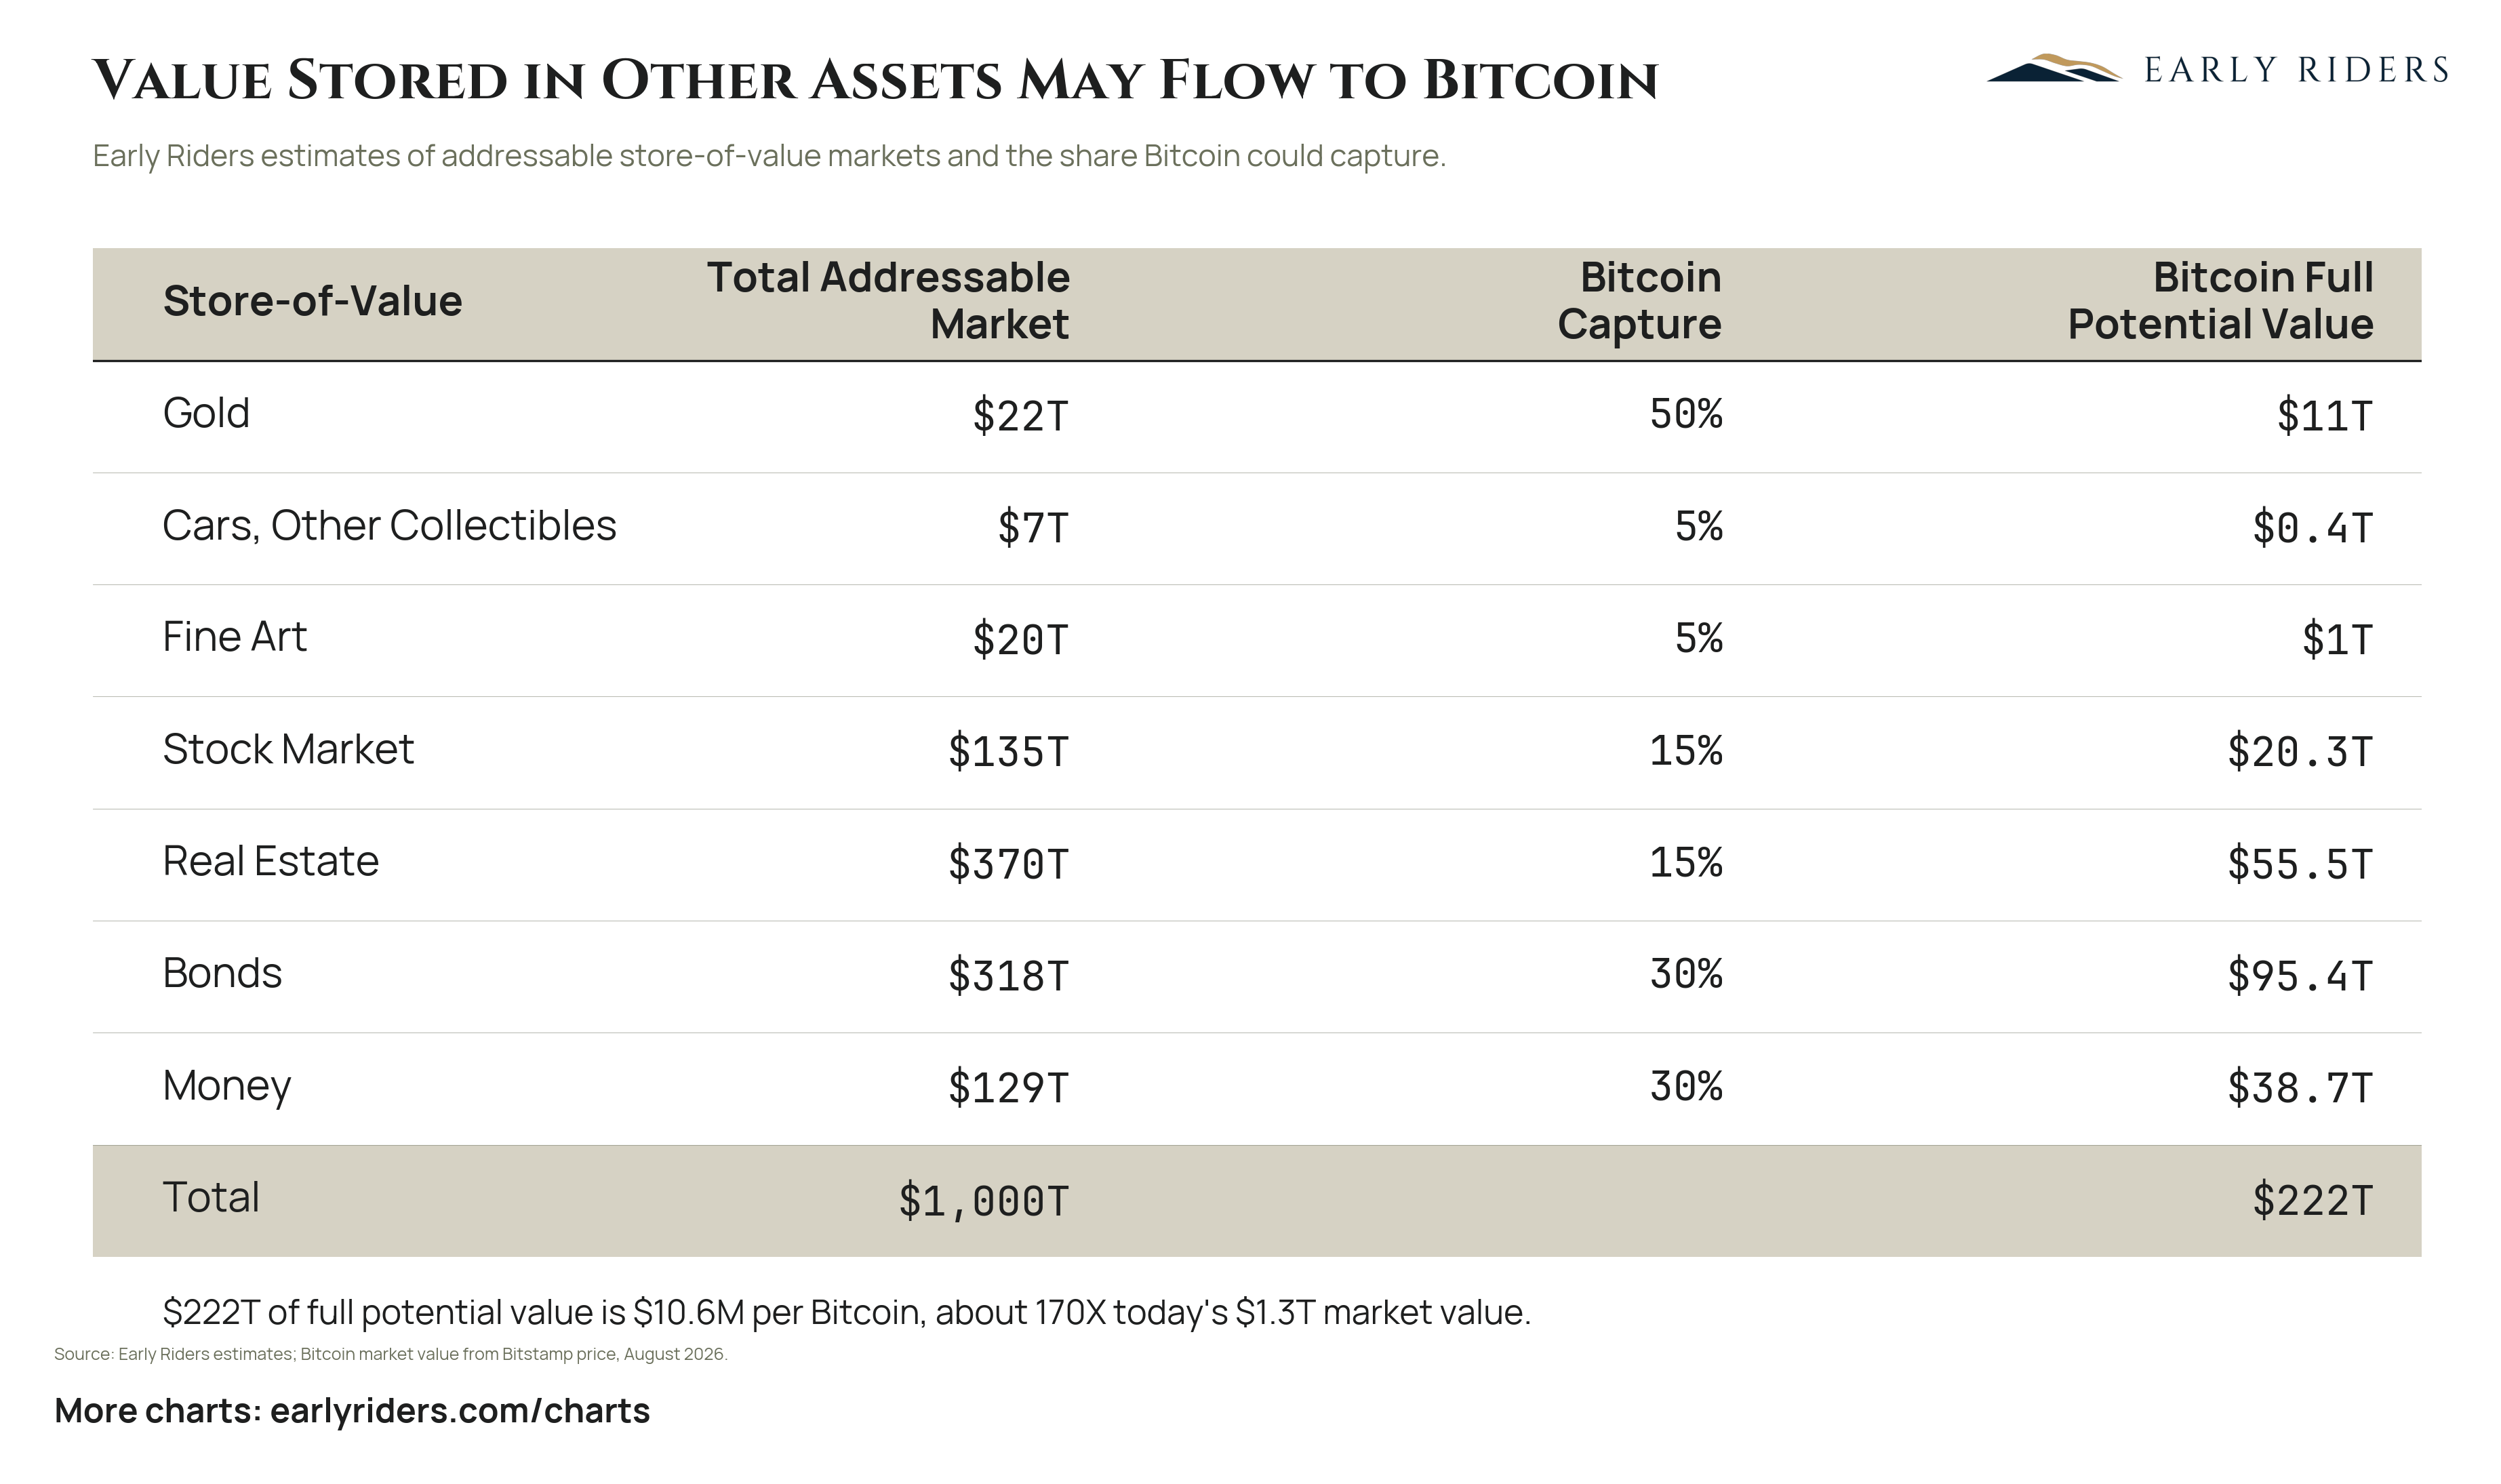
Early Riders estimates that Bitcoin capturing 5% to 50% of about $1,000T in store-of-value markets implies $222T of full potential value, or about $10.6M per coin.
The framing treats Bitcoin as a claim on the demand for storing value rather than as a technology bet. Early Riders sizes seven pools: real estate at $370T, bonds at $318T, the stock market at $135T, money at $129T, gold at $22T, fine art at $20T, and cars and other collectibles at $7T. That comes to about $1,000T of assets held at least partly because they are expected to hold value over time.
The assumed capture rates carry the argument, and they are estimates rather than observations. Gold is set at 50%, on the view that Bitcoin's monetary properties make it a close substitute. Bonds and money take 30% each. Stocks and real estate take 15%, since most of their value is productive rather than monetary. Art and collectibles take 5%. The result is $222T of full potential value, with bonds at $95.4T and real estate at $55.5T supplying the largest pieces.
That $222T works out to $10.6M per Bitcoin, roughly 170X the $1.3T market value in August 2026. Nothing in the table attaches a date. What it does is convert an abstract thesis into explicit assumptions a reader can argue with line by line, which is the only honest way to size a position this asymmetric.
What could Bitcoin be worth if it captures the store-of-value market?
Early Riders estimates $222T of full potential value for Bitcoin, about $10.6M per coin and roughly 170X its $1.3T market value in August 2026. That applies capture rates of 5% to 50% across about $1,000T of store-of-value markets including real estate, bonds, stocks and gold. These are estimates.
Chart data: Early Riders estimates of addressable store-of-value markets and the share Bitcoin could capture.
Plotted
Store-of-Value, Total Addressable Market, Bitcoin Capture, Bitcoin Full Potential Value
Source
Early Riders estimates; Bitcoin market value from Bitstamp price, August 2026.
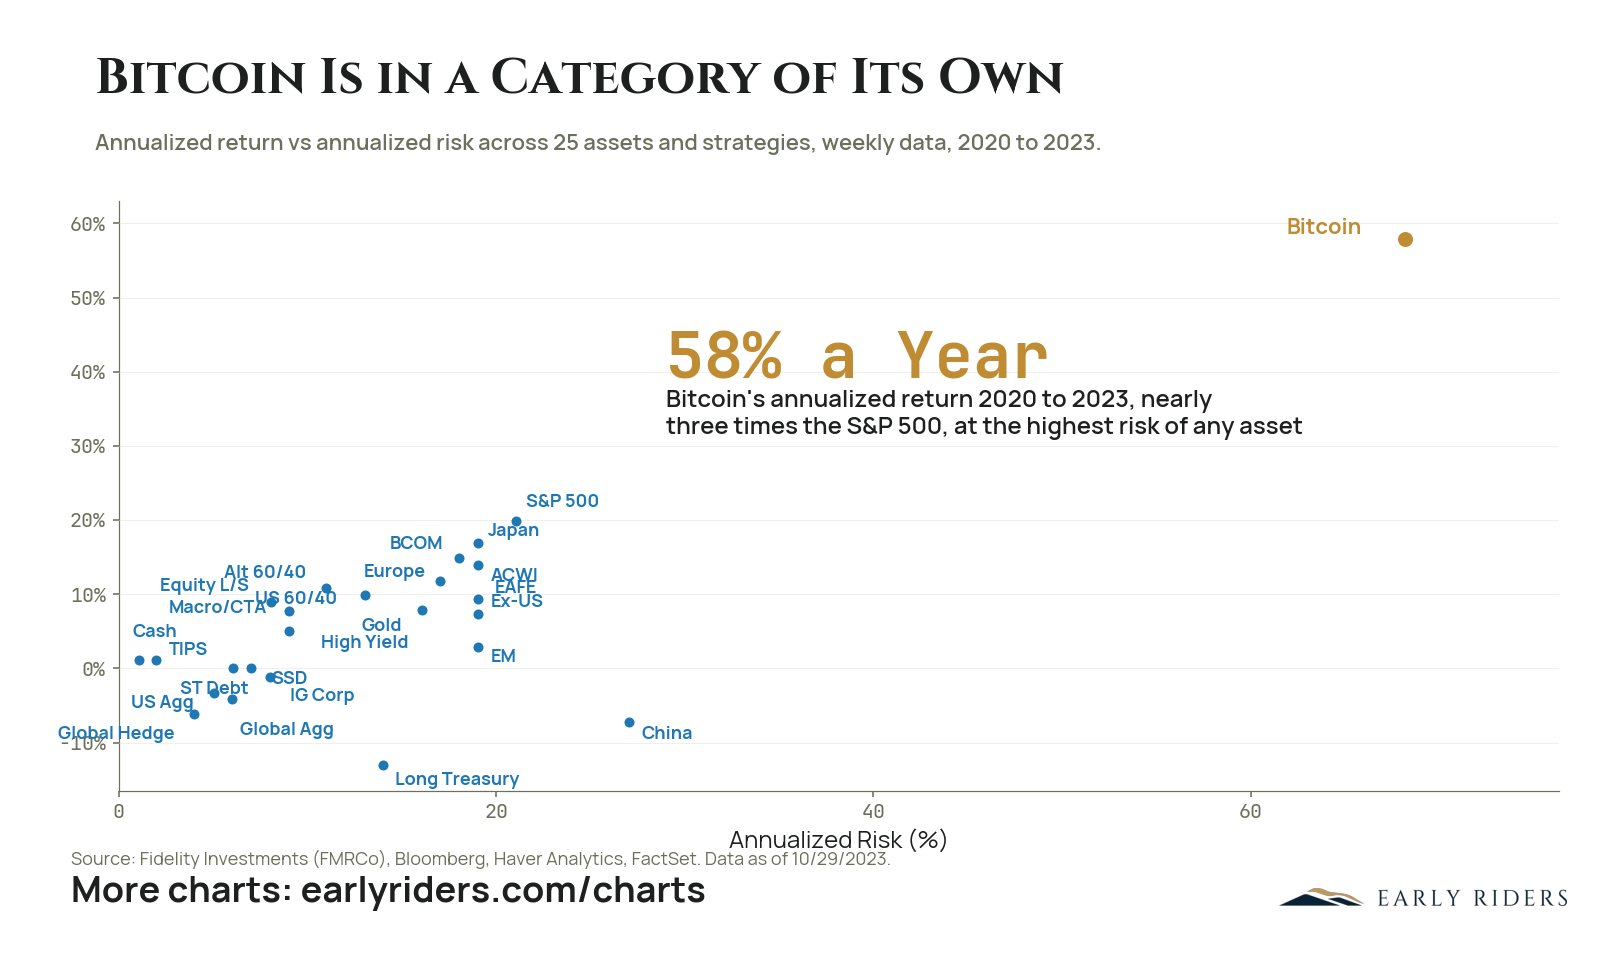
Bitcoin returned about 58% a year from 2020 to 2023 at roughly 68% annualized risk, sitting far outside the cluster formed by 24 other assets and strategies.
Fidelity plotted 25 assets and strategies on annualized return against annualized risk using weekly data from 2020 to 2023. Twenty-four of them form a tight cluster: none returned more than about 20% a year, and none carried more than about 30% annualized risk. The S&P 500 anchors the top of that group at roughly 20% return and 21% risk. Gold sits near 8% return at about 15% risk. Long Treasury is the worst performer at about -13%, with China near -7%.
Bitcoin sits alone in the upper right at about 58% annualized return and about 68% annualized risk, nearly three times the S&P 500's return at more than three times its volatility. The underlying data is Fidelity's, drawn from Bloomberg, Haver Analytics and FactSet as of 10/29/2023.
An asset positioned that far from the cluster cannot be fitted into an existing sleeve. Grouping it with equities understates its volatility, and grouping it with venture understates its liquidity. The practical consequence is that position size, rather than entry price, dominates the outcome. A weight small enough to survive a drawdown of this magnitude still moves the return of the whole portfolio, which is the case for sizing Bitcoin as its own category and holding it across cycles.
How does Bitcoin's risk and return compare to stocks and other assets?
Bitcoin returned about 58% a year from 2020 to 2023 at roughly 68% annualized risk, nearly three times the S&P 500's 20% return and the highest risk of the 25 assets measured. Every other asset returned under about 20%. Data from Fidelity Investments, Bloomberg, Haver Analytics and FactSet, as of 10/29/2023.
Chart data: Annualized return vs annualized risk across 25 assets and strategies, weekly data, 2020 to 2023.
Period
2020 to 2023
Plotted
Bitcoin, S&P 500, Japan, BCOM, ACWI, Europe, EAFE, Ex-US, EM, Gold, High Yield, Alt 60/40, Equity L/S, US 60/40, Macro/CTA, Cash, TIPS, SSD, ST Debt, IG Corp, US Agg, Global Agg, Global Hedge, China, Long Treasury
Source
Fidelity Investments (FMRCo), Bloomberg, Haver Analytics, FactSet. Data as of 10/29/2023.
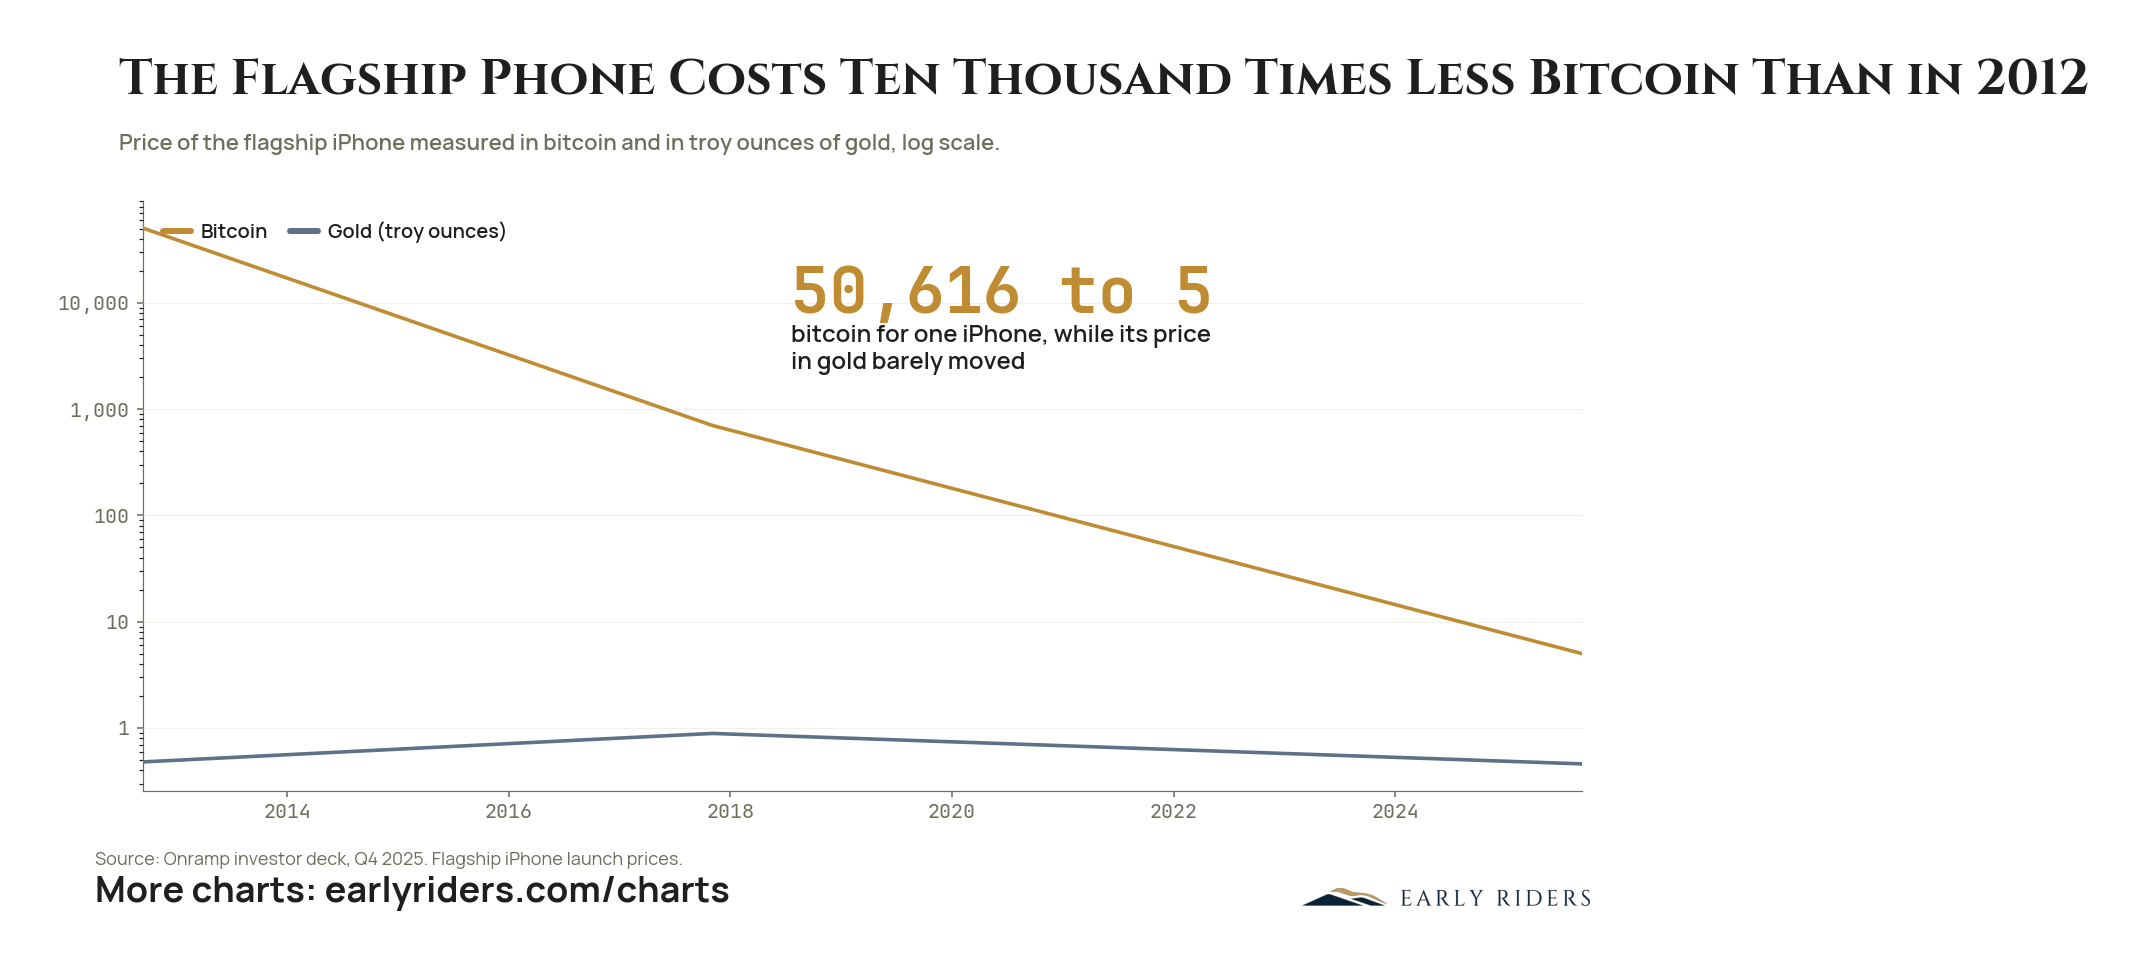
A flagship iPhone cost 50,616 bitcoin in 2012 and about 5 bitcoin in 2025, while its price in gold moved only from 0.48 troy ounces to 0.46.
A flagship iPhone cost roughly 50,616 bitcoin at the iPhone 5's launch in 2012. By the iPhone 17 Pro in 2025 the same purchase took about 5 bitcoin, a decline of more than ten thousand times in thirteen years.
The gold line is what turns this from a curiosity into an argument. Measured in troy ounces the same phone cost 0.48 ounces in 2012 and 0.46 in 2025, with a brief rise to 0.89 at the iPhone X, whose launch price jumped while gold was relatively cheap. Against a monetary metal that has held its role for four thousand years, a flagship phone costs almost exactly what it always did. The product did not become dramatically cheaper to build and gold did not become dramatically weaker. What changed is the unit.
This is the denominator argument in its simplest available form. Priced in dollars, consumer electronics look roughly flat to modestly more expensive, which is what most people actually experience. Priced in a money whose supply cannot be expanded, the same goods collapse in cost, because thirteen years of manufacturing and semiconductor progress show up in the price instead of being absorbed by the currency. For anyone deciding what to hold, the question is not whether phones got cheaper. It is which unit was telling the truth.
How much has an iPhone fallen in price when measured in bitcoin?
A flagship iPhone cost about 50,616 bitcoin in 2012 and roughly 5 bitcoin by 2025, a decline of more than ten thousand times. Measured in gold the price barely moved, from 0.48 troy ounces to 0.46, which isolates bitcoin's monetary appreciation from any change in the product itself.
Chart data: Price of the flagship iPhone measured in bitcoin and in troy ounces of gold at three launches, 2012, 2017 and 2025, on a log scale.
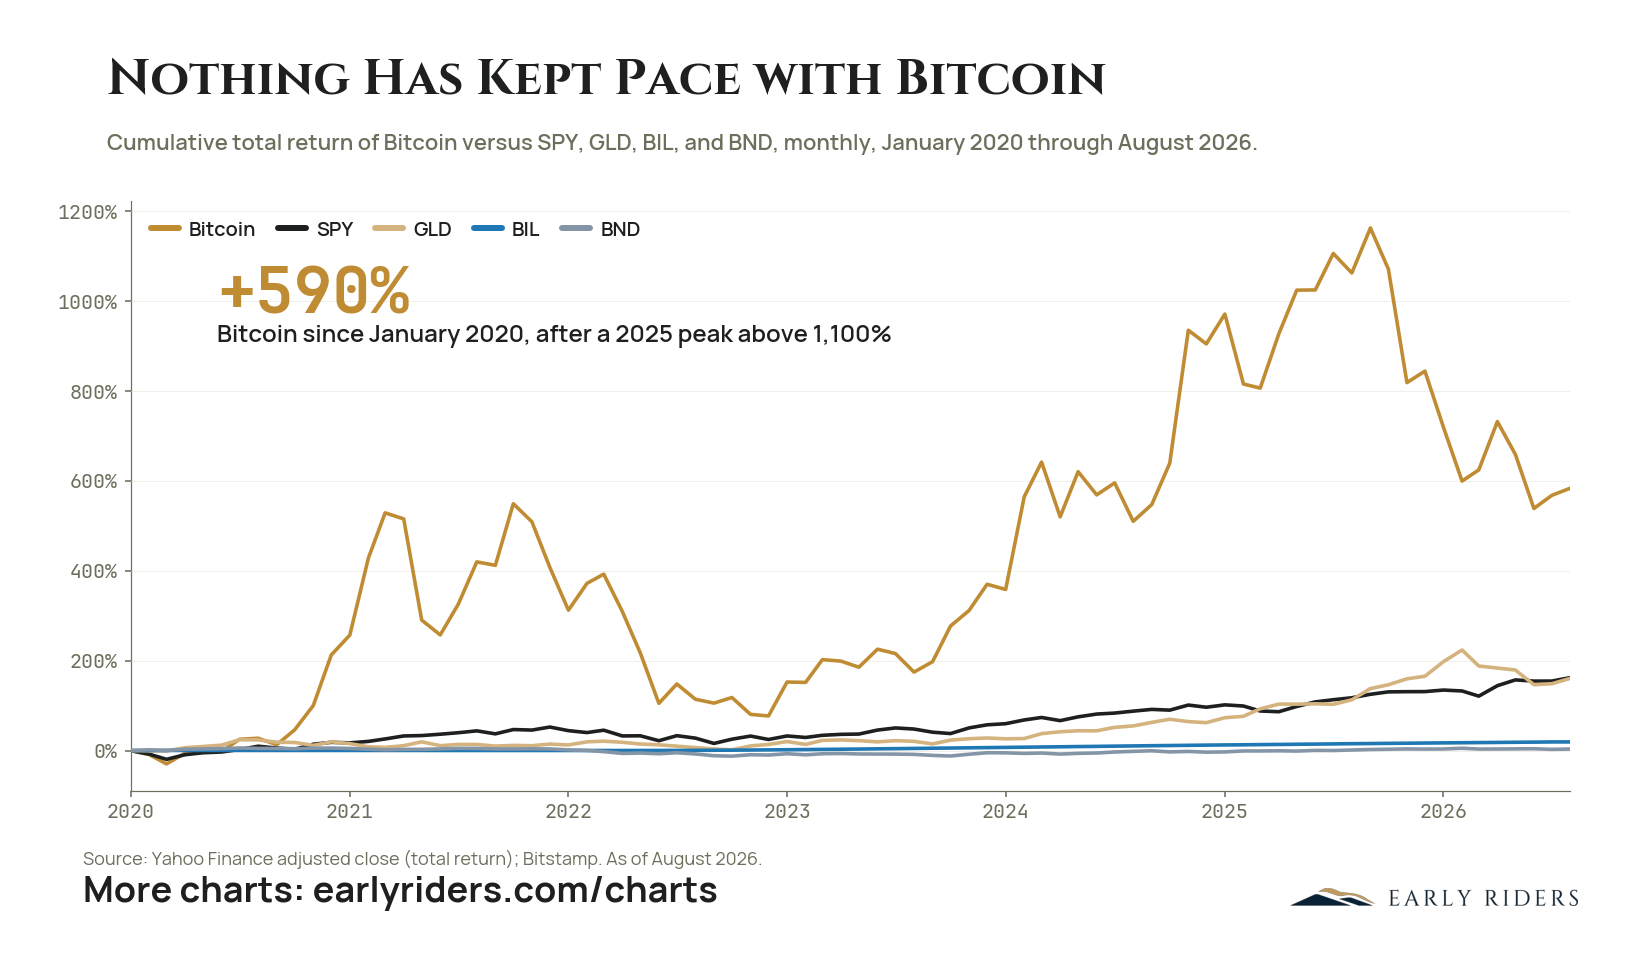
Bitcoin returned about 590% from January 2020 through August 2026, roughly four times what equities or gold delivered and far above the near-zero return on bills and bonds.
From January 2020 through August 2026, Bitcoin returned about 590% on a cumulative total-return basis. Over the same months SPY and GLD each delivered roughly 150%, while BIL and BND finished close to flat, with the bond fund spending long stretches of 2022 and 2023 below its starting point. No other liquid asset on the chart came within a factor of three.
That 590% is a post-drawdown figure. Bitcoin peaked above 1,100% in 2025 and gave back roughly half of the cumulative gain by mid-2026, and it still ends the period several times ahead of equities and gold. The asset that set the return bar did not clear it smoothly, and the 2021 to 2023 stretch shows the same pattern at smaller scale, with the cumulative line falling from above 500% to below 100%.
Two consequences follow for anyone holding or deploying capital. The near-flat BIL line is a direct measure of what sitting in cash-like instruments cost over these six and a half years. The path, meanwhile, is the real constraint: a position sized so that a 50% give-back forces a sale turns the best performer of the period into a realized loss. Selection was the easy part of this trade.
How has Bitcoin performed compared to stocks, gold, and bonds since 2020?
Bitcoin returned about 590% from January 2020 through August 2026, against roughly 150% for SPY and GLD and near zero for BIL and BND. Bitcoin peaked above 1,100% in 2025 before giving back part of that gain, and still finished the period well ahead of every other asset shown.
Chart data: Cumulative total return of Bitcoin versus SPY, GLD, BIL, and BND, monthly, January 2020 through August 2026.
Period
January 2020 through August 2026
Plotted
Bitcoin, SPY, GLD, BIL, BND
Source
Yahoo Finance adjusted close (total return); Bitstamp. As of August 2026.
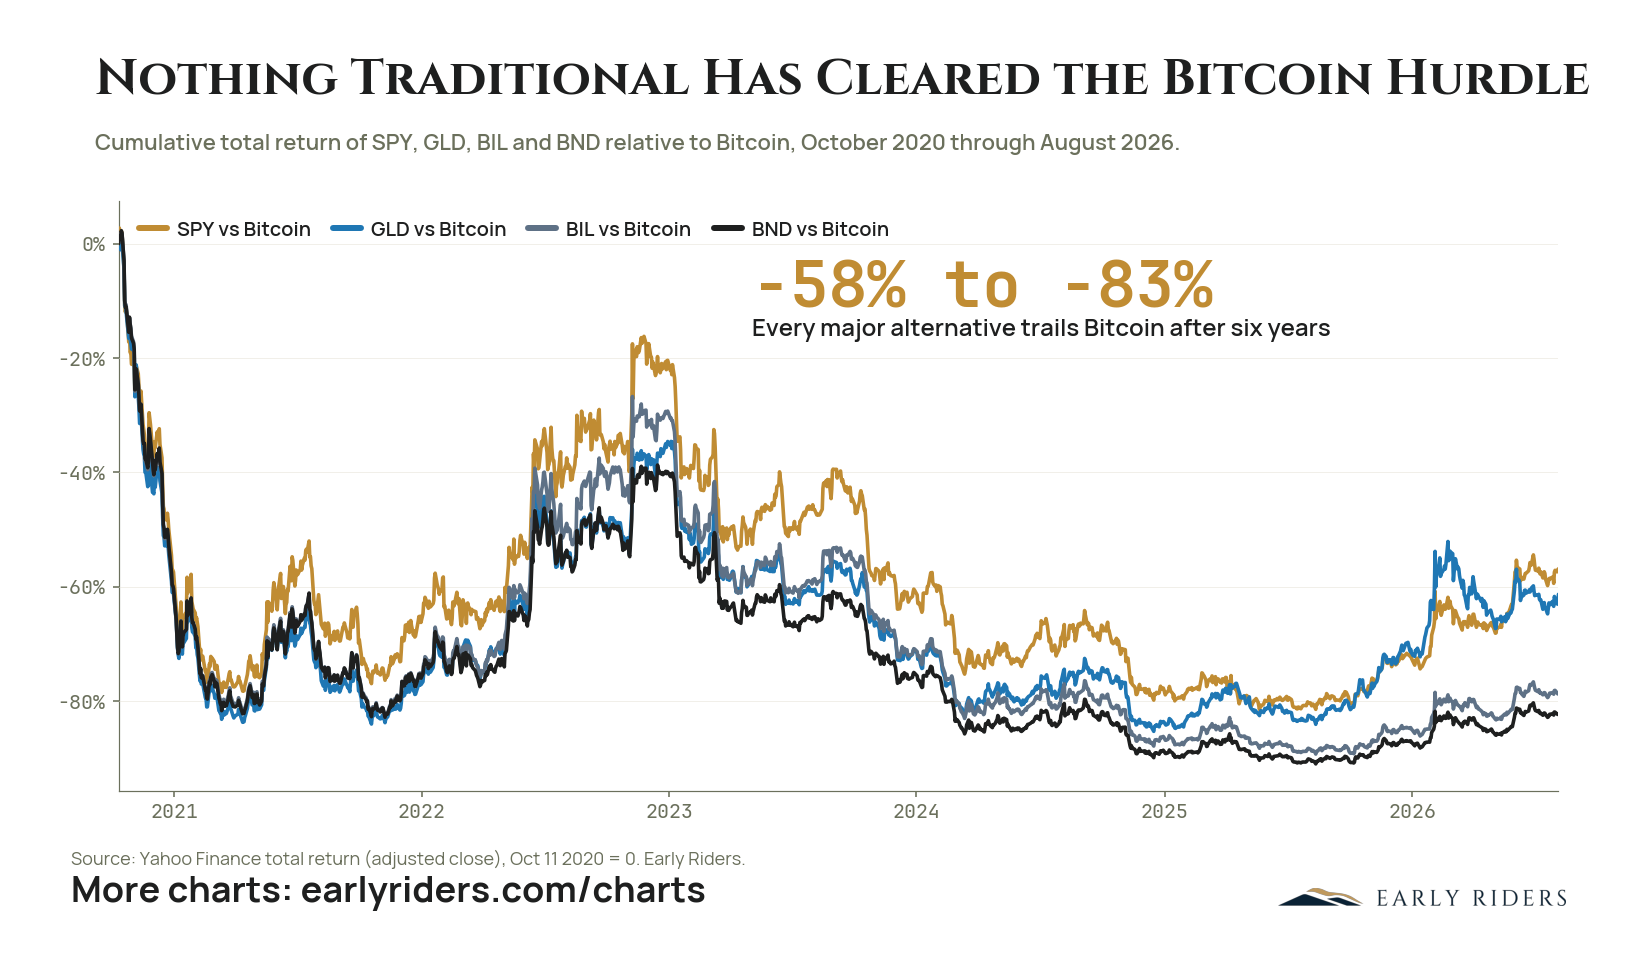
Priced in bitcoin, US equities, gold, Treasury bills and bonds are all down between 58% and 83% since October 2020, and none has been ahead at any point in those six years.
Measured against bitcoin rather than dollars, the four standard portfolio building blocks have all lost ground since October 2020. SPY sits about 58% behind, gold about 62%, Treasury bills about 79% and aggregate bonds about 83%. More telling than the endpoints is that not one of the four lines has touched zero in nearly six years. The closest any came was late 2022, at the bottom of the last bitcoin drawdown, when SPY had narrowed the gap to roughly 17%. Even that was a deficit. The series then widened again through 2024 and 2025 to about 80% or worse for all four before bitcoin's own 2026 decline pulled equities and gold back toward 60%. Returns are total return from Yahoo Finance adjusted close, indexed to October 11, 2020, with the comparison built by Early Riders. The use of this is not to argue that bonds were a mistake in isolation. It is to establish what the opportunity cost has actually been. If bitcoin is the benchmark a portfolio has to beat, then six years of data say nothing conventional has beaten it, including through a period that contained two severe bitcoin drawdowns. Anyone underwriting a new position should be asked to clear that bar explicitly.
How have stocks, gold and bonds performed compared to bitcoin since 2020?
All have lost ground. Priced in bitcoin from October 2020 through August 2026, SPY is down about 58%, gold about 62%, Treasury bills about 79% and aggregate bonds about 83%. None of the four has been ahead of bitcoin at any point in that six-year span.
Chart data: Cumulative total return of SPY, GLD, BIL and BND relative to Bitcoin, October 2020 through August 2026.
Period
October 2020 through August 2026
Plotted
SPY vs Bitcoin, GLD vs Bitcoin, BIL vs Bitcoin, BND vs Bitcoin
Source
Yahoo Finance total return (adjusted close), Oct 11 2020 = 0. Early Riders.
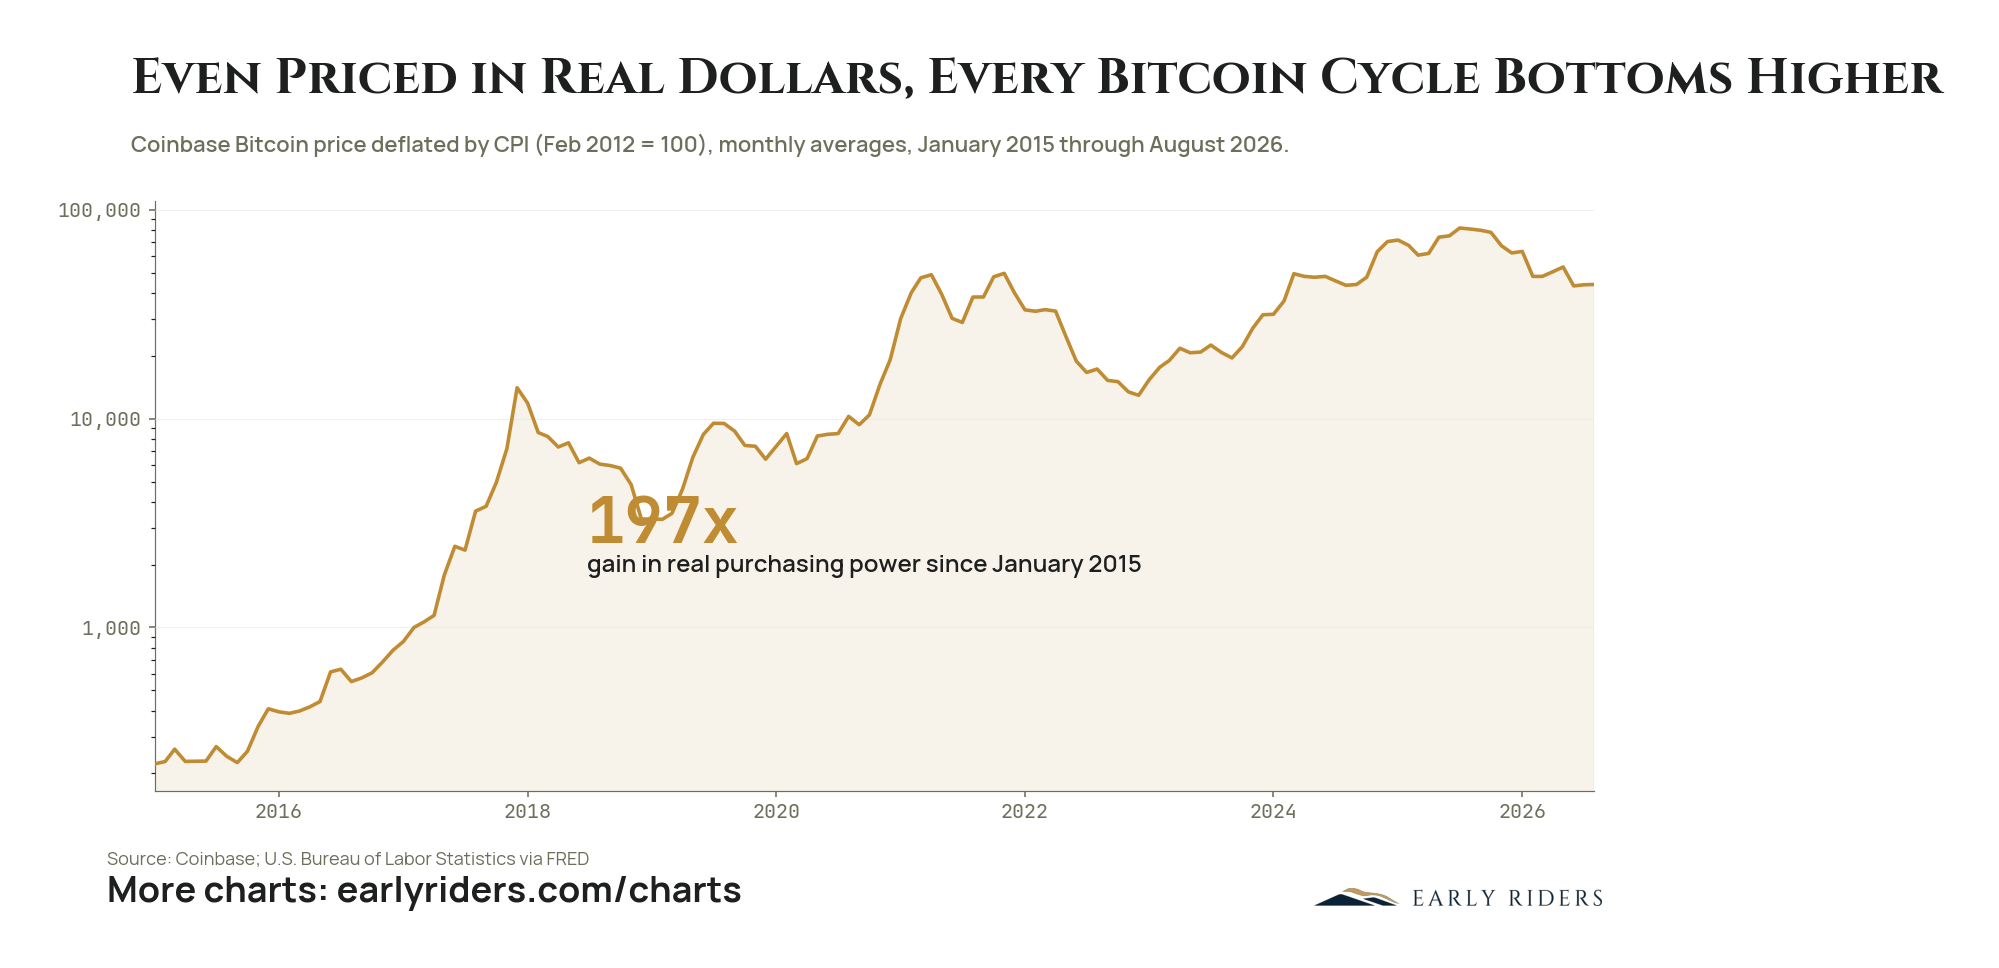
Priced in constant dollars rather than nominal ones, Bitcoin has gained 197x in purchasing power since January 2015 and every cycle low has printed above the one before it.
Deflating the Coinbase Bitcoin price by CPI strips out the part of the gain that is only dollar debasement, and what is left is still large. Measured in constant dollars indexed to February 2012, Bitcoin has multiplied real purchasing power 197 times since January 2015, with the series reading 43,715 as of August 2026. The level matters less than the shape underneath it. On a log scale, each cycle low prints above the one before it: the 2018 and 2019 trough held above 3,000 in real terms, the 2022 and 2023 trough held above 10,000, and the pullback from the 2025 high has left the series near 43,700. Repeated drawdowns of well over half the price occurred inside this window without resetting the floor.
For anyone holding Bitcoin, the inflation-adjusted view answers the common objection that the entire move is a nominal illusion produced by an expanding money supply. It is not, at least not over eleven years of monthly data. For anyone deploying capital, the rising sequence of lows argues for sizing a position to survive a full cycle rather than trading around each drawdown. The risk to underwrite is a decline you can hold through, not the loss of the trend itself.
Has Bitcoin actually gone up after adjusting for inflation?
Adjusted for CPI, Bitcoin has gained 197x in real purchasing power since January 2015, with the inflation-adjusted price at 43,715 as of August 2026 on a February 2012 base. Each cycle low over that period printed above the previous one, so drawdowns have not reversed the underlying trend.
Chart data: Coinbase Bitcoin price deflated by CPI (Feb 2012 = 100), monthly averages, January 2015 through August 2026.
Period
January 2015 through August 2026
Plotted
Inflation-adjusted Bitcoin price
Source
Coinbase; U.S. Bureau of Labor Statistics via FRED
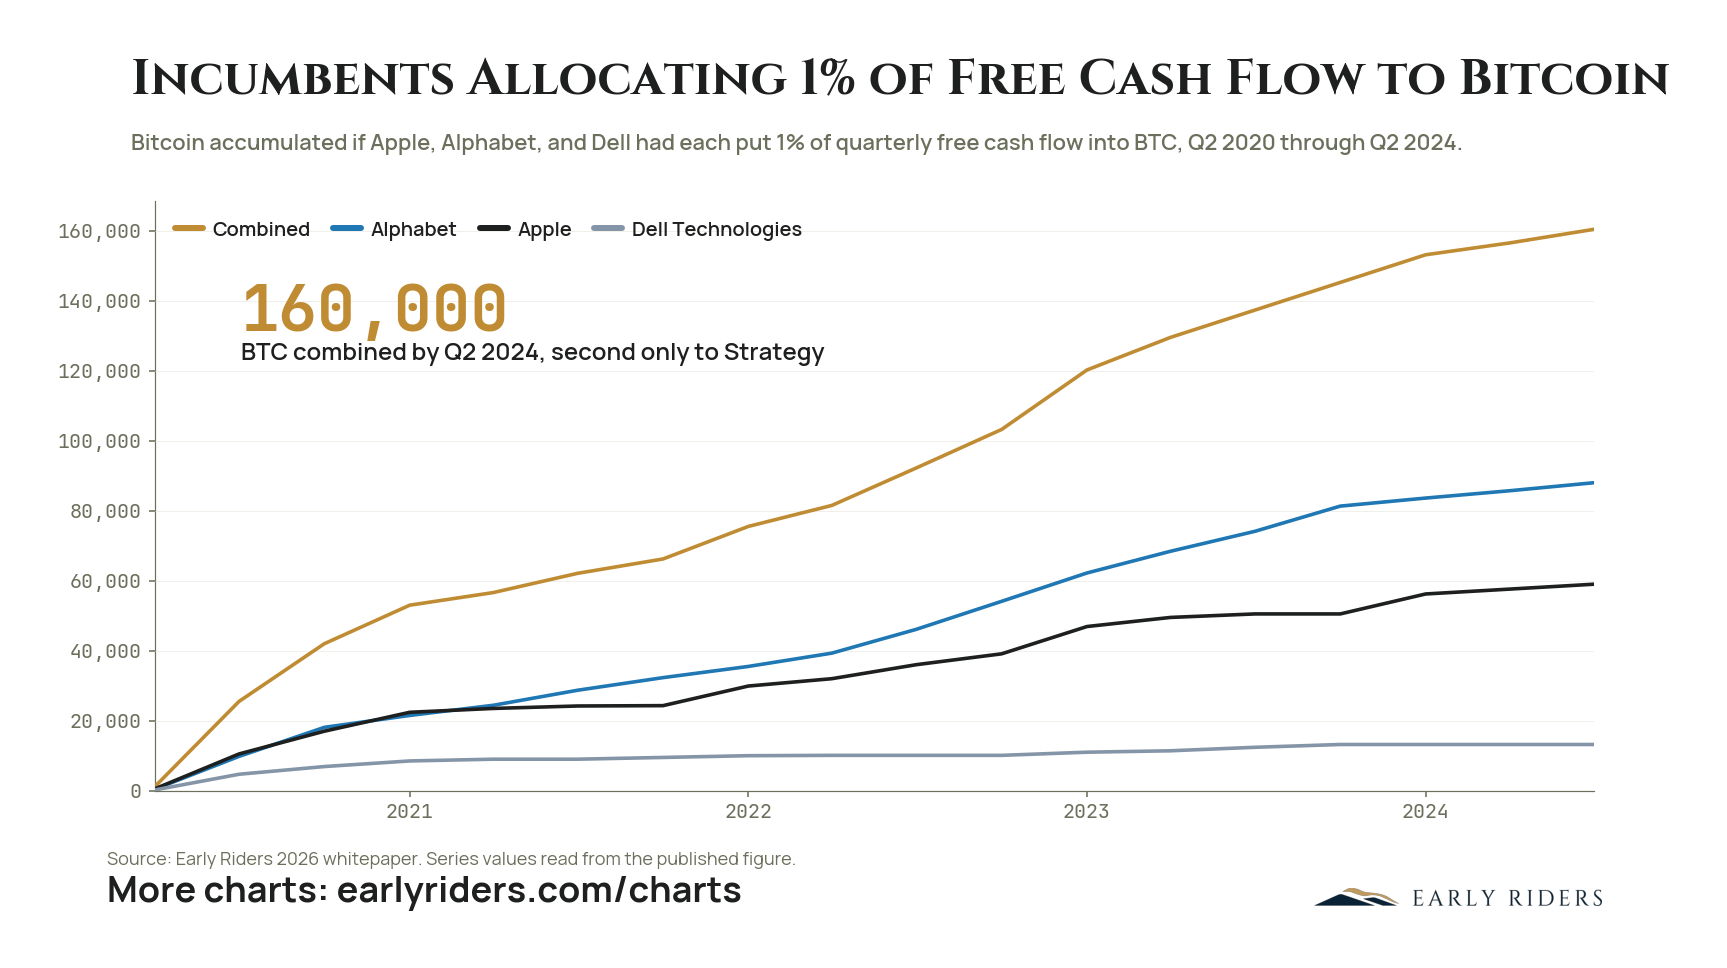
Had Apple, Alphabet, and Dell each put just 1% of quarterly free cash flow into Bitcoin from mid-2020, they would together hold about 160,000 BTC by Q2 2024.
This is a counterfactual, not a record of holdings. It models what would have happened if Apple, Alphabet, and Dell had each directed 1% of quarterly free cash flow into Bitcoin from Q2 2020 through Q2 2024, with series values read from the published Early Riders figure. The combined position reaches about 160,000 BTC by Q2 2024: roughly 88,000 for Alphabet, 59,000 for Apple, and 13,000 for Dell. That combined stack would rank second only to Strategy among corporate holders.
The proportion is what makes the exercise worth running. One percent of free cash flow is inside the rounding error of a treasury policy at companies of this size, well below what any of them spends on buybacks in a single quarter, and it required no change in operating strategy or capital structure. The accumulation is also front-loaded, with the combined line clearing 50,000 BTC by early 2021 while prices were still low.
For anyone advising a balance sheet with recurring free cash flow, the lesson is that meaningful Bitcoin exposure never required a large commitment, only an early and consistent one. The companies that did nothing did not avoid a decision; they made one, and this chart prices it.
How much Bitcoin would Apple, Alphabet, and Dell own if they had invested 1% of free cash flow?
About 160,000 BTC combined by Q2 2024, split roughly 88,000 for Alphabet, 59,000 for Apple, and 13,000 for Dell, if each had put 1% of quarterly free cash flow into Bitcoin from Q2 2020. That is a modeled scenario, not actual holdings, and would rank second only to Strategy.
Chart data: Bitcoin accumulated if Apple, Alphabet, and Dell had each put 1% of quarterly free cash flow into BTC, Q2 2020 through Q2 2024.
Period
Q2 2020 through Q2 2024
Plotted
Combined, Alphabet, Apple, Dell Technologies
Source
Early Riders 2026 whitepaper. Series values read from the published figure.
Get Open Range, the weekly Early Riders letter on Bitcoin, AI, and digital asset markets — a front-row seat to the singularity, delivered directly to your inbox.